lurking variable exercises Solutions
advertisement
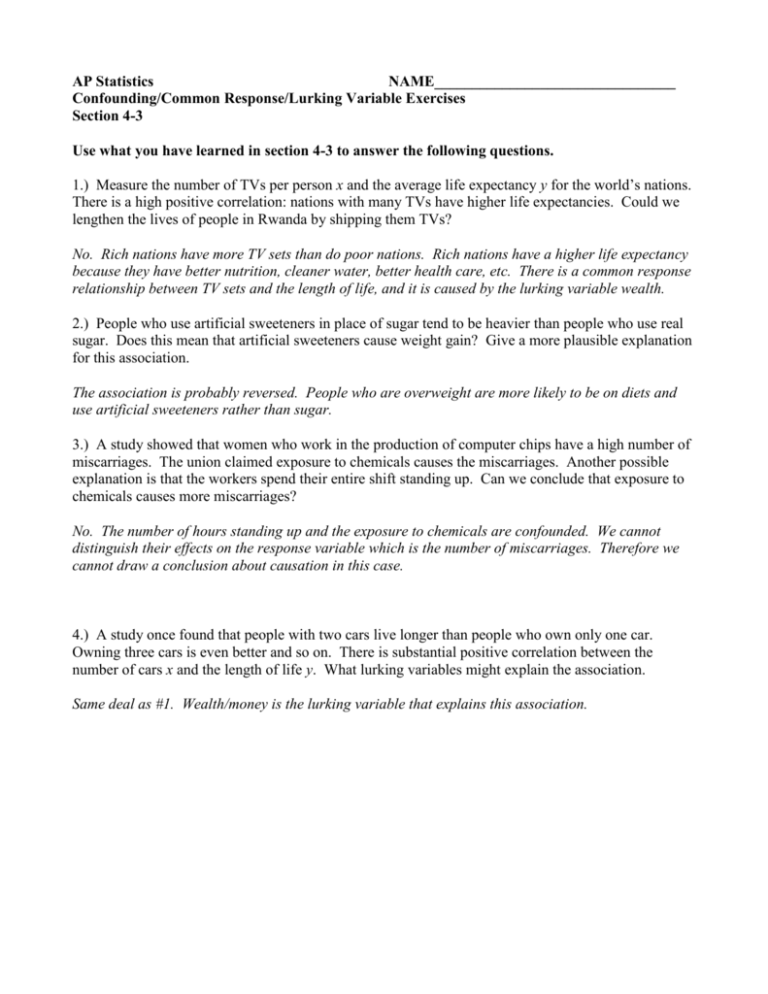
AP Statistics NAME________________________________ Confounding/Common Response/Lurking Variable Exercises Section 4-3 Use what you have learned in section 4-3 to answer the following questions. 1.) Measure the number of TVs per person x and the average life expectancy y for the world’s nations. There is a high positive correlation: nations with many TVs have higher life expectancies. Could we lengthen the lives of people in Rwanda by shipping them TVs? No. Rich nations have more TV sets than do poor nations. Rich nations have a higher life expectancy because they have better nutrition, cleaner water, better health care, etc. There is a common response relationship between TV sets and the length of life, and it is caused by the lurking variable wealth. 2.) People who use artificial sweeteners in place of sugar tend to be heavier than people who use real sugar. Does this mean that artificial sweeteners cause weight gain? Give a more plausible explanation for this association. The association is probably reversed. People who are overweight are more likely to be on diets and use artificial sweeteners rather than sugar. 3.) A study showed that women who work in the production of computer chips have a high number of miscarriages. The union claimed exposure to chemicals causes the miscarriages. Another possible explanation is that the workers spend their entire shift standing up. Can we conclude that exposure to chemicals causes more miscarriages? No. The number of hours standing up and the exposure to chemicals are confounded. We cannot distinguish their effects on the response variable which is the number of miscarriages. Therefore we cannot draw a conclusion about causation in this case. 4.) A study once found that people with two cars live longer than people who own only one car. Owning three cars is even better and so on. There is substantial positive correlation between the number of cars x and the length of life y. What lurking variables might explain the association. Same deal as #1. Wealth/money is the lurking variable that explains this association. 5.) Children who watch many hours of TV get lower grades in school on the average than those who watch less TV. Suggest some other variables that may be confounded with heavy TV watching and may contribute to poor grades. One possibility is children who do poorly in school tend to watch TV because they don’t like school and would do anything rather than homework. Another possibility is lack of parental involvement. If the kids are watching too much TV then the parents might not be concerned with their kid’s education or the parents might be concerned, but might have to work because of their economic situation. 6.) Data show that men, who are married, and also divorced or widowed men, earn quite a bit more than men the same age who have never been married. Does this mean that getting married can increase your salary? No. For single men, earning money might not be a top priority, but when you get married it becomes a top priority. Also age is a lurking variable. Men who are married tend to be older than single men and therefore would have more experience and in many cases a higher salary. 7.) A study finds that HS students, who take the SAT, enroll in an SAT course, and then take the SAT a second time raise their SAT math score from a mean of 521 to 561. What factors other than taking the course might explain this improvement. Familiarity with the test. More time has passed to get smarter. 8.) People who do well tend to feel good about themselves do better in school than those people who do not. Can you think of explanations for the association between high self-esteem and good school performance? It is probably an association in the other direction. Doing well in school will improve you self esteem. 9.) There is a negative correlation between the number of flu cases reported each week throughout the year and the amount of ice cream sold in that particular week. Does ice cream prevent the flu? No. People tend to eat ice cream in the warmer months which is when people are less vulnerable to getting the flu. The flu season is generally the winter when it is cold and most people are not eating ice cream. The temperature/weather is the lurking variable.
