ME 402 Lab 1: First-Order Time Response of a Thermal System Q1
advertisement
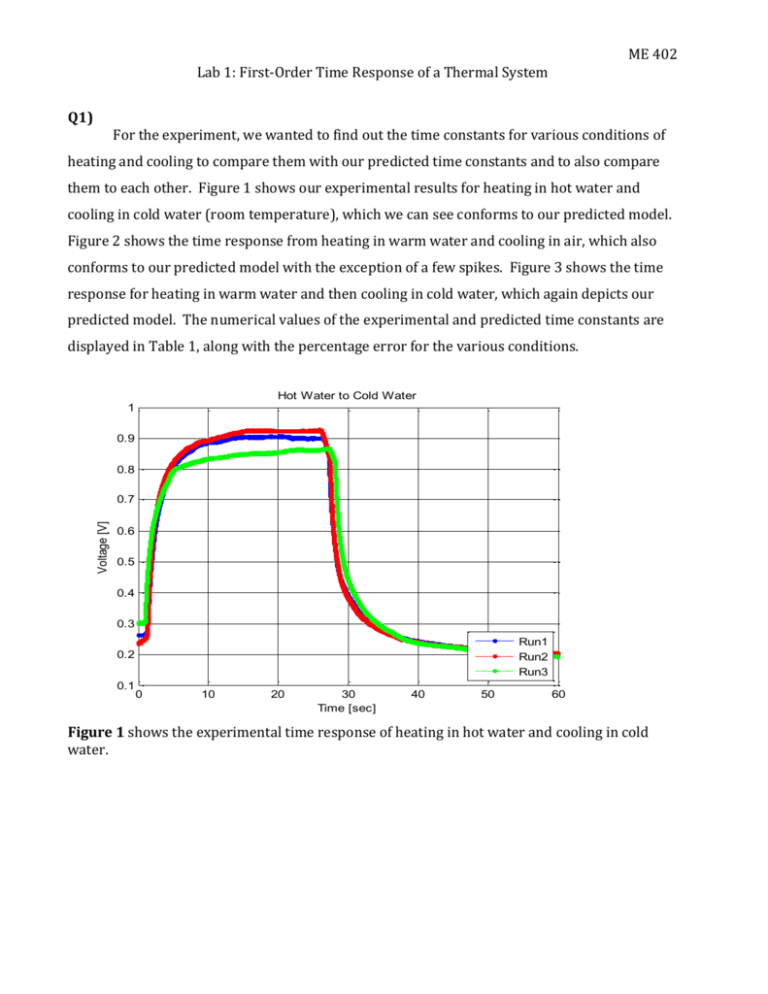
ME 402 Lab 1: First-Order Time Response of a Thermal System Q1) For the experiment, we wanted to find out the time constants for various conditions of heating and cooling to compare them with our predicted time constants and to also compare them to each other. Figure 1 shows our experimental results for heating in hot water and cooling in cold water (room temperature), which we can see conforms to our predicted model. Figure 2 shows the time response from heating in warm water and cooling in air, which also conforms to our predicted model with the exception of a few spikes. Figure 3 shows the time response for heating in warm water and then cooling in cold water, which again depicts our predicted model. The numerical values of the experimental and predicted time constants are displayed in Table 1, along with the percentage error for the various conditions. Hot Water to Cold Water 1 0.9 0.8 Voltage [V] 0.7 0.6 0.5 0.4 0.3 Run1 Run2 Run3 0.2 0.1 0 10 20 30 Time [sec] 40 50 60 Figure 1 shows the experimental time response of heating in hot water and cooling in cold water. ME 402 Lab 1: First-Order Time Response of a Thermal System Warm Water to Air 0.6 0.5 Voltage [V] 0.4 0.3 0.2 0.1 Air1 Air2 Air3 0 -0.1 0 10 20 30 Time [sec] 40 50 60 Figure 2 displays the experimental time response for heating in warm water and cooling in air. Warm Water to Cold Water 0.8 0.7 Voltage [V] 0.6 0.5 0.4 0.3 Warm1 Warm2 Warm3 0.2 0.1 0 10 20 30 Time [sec] 40 50 60 Figure 3 depicts the time response for heating in warm water and cooling in cold water. ME 402 Lab 1: First-Order Time Response of a Thermal System Temp (deg C) Time Constant (s) Trial Initial Run 1 26.19 90.64 20.08 1.997 2.331 Run 2 23.5 92.72 20.08 1.489 Run 3 29.97 86.74 19.11 Warm to Air Air 1 24.11 55.12 Air 2 35.83 Hot to Cold Air 3 Warm to Warm Cold 1 Warm 2 Warm 3 Peak Final Heating Predicted tau (s) Cooling Heating % Error Cooling Heating Cooling 2 3 0.170 28.700 2.497 2 3 34.300 20.163 1.740 2.576 2 3 14.929 16.460 36.07 1.733 14.785 2 15 15.420 1.456 54.26 38.52 1.466 15.050 2 15 36.454 0.335 34.24 53.41 37.29 1.289 14.548 2 15 55.195 3.108 24.11 56.34 17.52 1.508 2.922 2 3 32.600 2.687 23.38 54.51 18.49 2.308 2.962 2 3 13.337 1.276 24.11 68.06 18.49 1.645 2.964 2 3 21.603 1.204 Table 1 shows our experimental and predicted results for the various conditions. Examining our results in table 1, we can see that our percentage errors from the predicted model to our experimental results were not that great: ranging from 0.170% to only 55.195%. Figure 4 shows our predicted model, and we can see that it correlates with all 9 of our experimental runs for the heating, through all the various conditions. In summary, the results of our experiment show that heating and cooling thermal systems can be modeled by a first order time response. ME 402 Lab 1: First-Order Time Response of a Thermal System Numerical Simulation of First-Order System 100 90 Steady State 80 Temp (degrees C) 70 Numerical Analytical 60 Time-Dependent 50 40 30 20 0 1 2 3 t/tau 4 5 6 Figure 4 shows our numerical and analytical predicted models we performed in the prelab. Lab 1: First-Order Time Response of a Thermal System ME 402 Q2) Trial Hot to Cold Run 1 Run 2 Run 3 Warm to Air Air 1 Air 2 Air 3 Warm to Cold Warm 1 Warm 2 Warm 3 Amplitude (deg C) Heating 64.45 69.22 56.77 Time Constant (s) Cooling Heating Cooling 70.56 1.997 2.331 72.64 1.489 2.497 67.63 1.740 2.576 31.01 18.43 19.17 19.05 15.74 16.12 1.733 1.466 1.289 14.785 15.050 14.548 32.23 31.13 43.95 38.82 36.02 49.57 1.508 2.308 1.645 2.922 2.962 2.964 Table 2 displays the amplitudes of the step inputs along with the time constants for the various runs. The time constant of a LTI, first order system in response to a step input is the same no matter how large the amplitude of the step input. As shown in table 2, there is no correlation between the amplitudes of the step inputs and the time constants. For example, the greatest and smallest time constants for heating (2.308 s and 1.289 s, respectively) corresponded to two of the smallest amplitudes (19.17oC and 31.13oC, respectively). This effectively shows that the time constant is not a function of the amplitude of the step input. One may argue that when looking at the cooling side, the smallest amplitudes (which were for trials with conditions of warm water to air) display the greatest time constants, so there may be a correlation, but we must consider that there was a difference between the heat transfer coefficients that could correspond to the change. After all, air has a much lower overall heat transfer coefficient, which could be the cause for the greater time constants.
