earthscienceps1-3 - Content Teaching Academy
advertisement
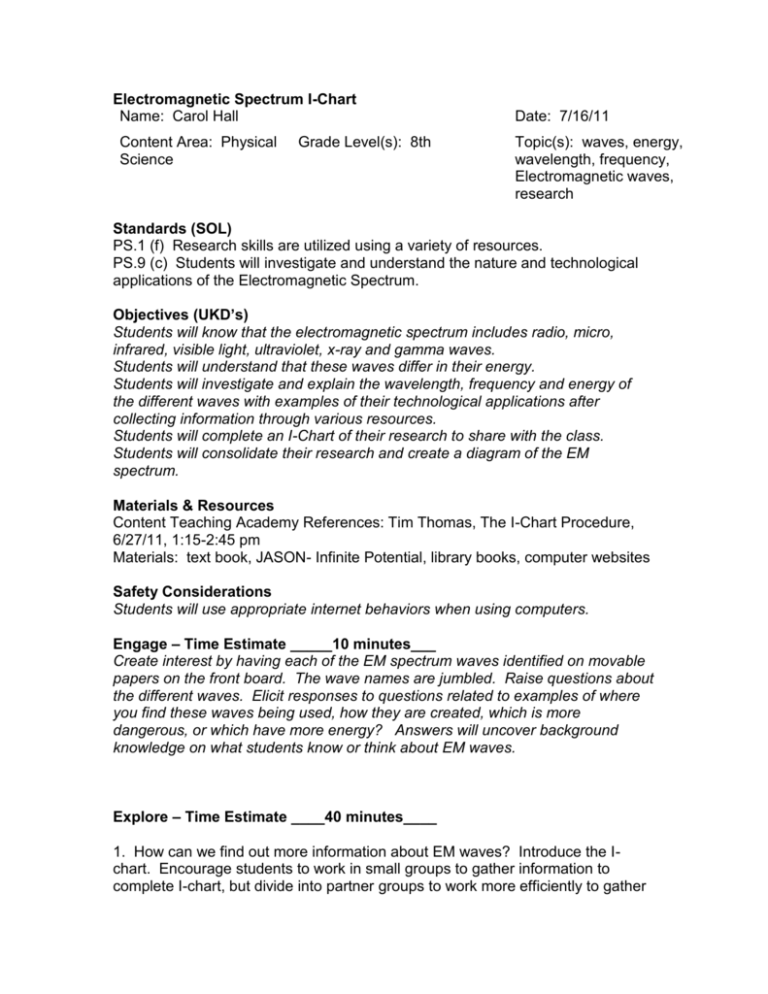
Electromagnetic Spectrum I-Chart Name: Carol Hall Content Area: Physical Science Grade Level(s): 8th Date: 7/16/11 Topic(s): waves, energy, wavelength, frequency, Electromagnetic waves, research Standards (SOL) PS.1 (f) Research skills are utilized using a variety of resources. PS.9 (c) Students will investigate and understand the nature and technological applications of the Electromagnetic Spectrum. Objectives (UKD’s) Students will know that the electromagnetic spectrum includes radio, micro, infrared, visible light, ultraviolet, x-ray and gamma waves. Students will understand that these waves differ in their energy. Students will investigate and explain the wavelength, frequency and energy of the different waves with examples of their technological applications after collecting information through various resources. Students will complete an I-Chart of their research to share with the class. Students will consolidate their research and create a diagram of the EM spectrum. Materials & Resources Content Teaching Academy References: Tim Thomas, The I-Chart Procedure, 6/27/11, 1:15-2:45 pm Materials: text book, JASON- Infinite Potential, library books, computer websites Safety Considerations Students will use appropriate internet behaviors when using computers. Engage – Time Estimate _____10 minutes___ Create interest by having each of the EM spectrum waves identified on movable papers on the front board. The wave names are jumbled. Raise questions about the different waves. Elicit responses to questions related to examples of where you find these waves being used, how they are created, which is more dangerous, or which have more energy? Answers will uncover background knowledge on what students know or think about EM waves. Explore – Time Estimate ____40 minutes____ 1. How can we find out more information about EM waves? Introduce the Ichart. Encourage students to work in small groups to gather information to complete I-chart, but divide into partner groups to work more efficiently to gather information from the various resources. Have student groups share with class how they are going to approach this research. 2. Students are to compare the different wavelengths, frequencies, energy and applications of each EM spectrum wave. This I-chart skeleton may be used as a guide and students can complete it on their own paper to have sufficient room to document their research information, I-Chart Guiding question 1 Guiding question 2 Guiding question 3 Guiding question 4 My research topic: Interesting New facts questions What I know right now Sources Summary Explain -- Time Estimate ____20 minutes____ Students will share with their partners and then their small groups and summarize their information. Groups will share their summaries with the whole class. Teacher can take this time to correct any assumptions or misinformation. Extend -- Time Estimate ___30 minutes_____ Students will work in small groups to create a visual/diagram poster representation that best portrays the key information the whole class summarized about the EM spectrum. Posters will be shared with the whole class and the best one can be recreated as a worksheet for all to add to their notebook. Evaluate -- Time Estimate ___10 minutes_____ Teacher will observe the I-Chart of each student. Students will share information in small groups and confer on information they can share with the whole class. Small groups will create a EM spectrum diagram of their information Plans for Diversity Students with difficulty reading may be given a guided notes version of the IChart. Students may also rely more on partner groups. Connections PS.1 allows research and reading skills to be developed within the content area. PS.9 reinforces information on the nature of waves.


