42 LAB-Radioactive Decay
advertisement
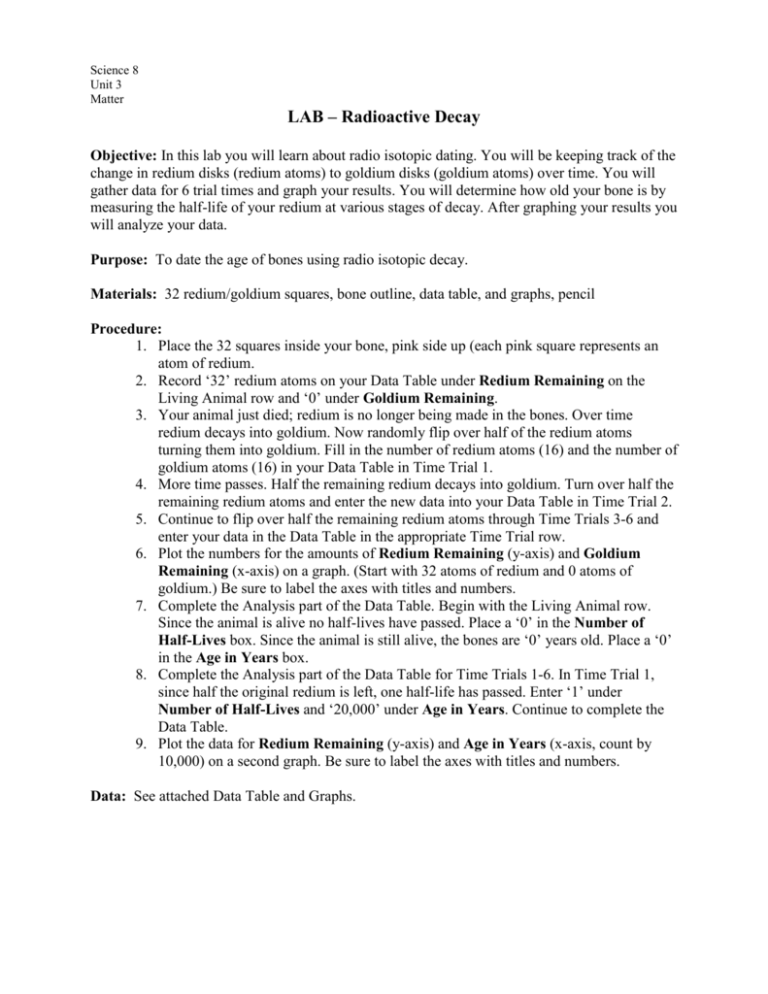
Science 8 Unit 3 Matter LAB – Radioactive Decay Objective: In this lab you will learn about radio isotopic dating. You will be keeping track of the change in redium disks (redium atoms) to goldium disks (goldium atoms) over time. You will gather data for 6 trial times and graph your results. You will determine how old your bone is by measuring the half-life of your redium at various stages of decay. After graphing your results you will analyze your data. Purpose: To date the age of bones using radio isotopic decay. Materials: 32 redium/goldium squares, bone outline, data table, and graphs, pencil Procedure: 1. Place the 32 squares inside your bone, pink side up (each pink square represents an atom of redium. 2. Record ‘32’ redium atoms on your Data Table under Redium Remaining on the Living Animal row and ‘0’ under Goldium Remaining. 3. Your animal just died; redium is no longer being made in the bones. Over time redium decays into goldium. Now randomly flip over half of the redium atoms turning them into goldium. Fill in the number of redium atoms (16) and the number of goldium atoms (16) in your Data Table in Time Trial 1. 4. More time passes. Half the remaining redium decays into goldium. Turn over half the remaining redium atoms and enter the new data into your Data Table in Time Trial 2. 5. Continue to flip over half the remaining redium atoms through Time Trials 3-6 and enter your data in the Data Table in the appropriate Time Trial row. 6. Plot the numbers for the amounts of Redium Remaining (y-axis) and Goldium Remaining (x-axis) on a graph. (Start with 32 atoms of redium and 0 atoms of goldium.) Be sure to label the axes with titles and numbers. 7. Complete the Analysis part of the Data Table. Begin with the Living Animal row. Since the animal is alive no half-lives have passed. Place a ‘0’ in the Number of Half-Lives box. Since the animal is still alive, the bones are ‘0’ years old. Place a ‘0’ in the Age in Years box. 8. Complete the Analysis part of the Data Table for Time Trials 1-6. In Time Trial 1, since half the original redium is left, one half-life has passed. Enter ‘1’ under Number of Half-Lives and ‘20,000’ under Age in Years. Continue to complete the Data Table. 9. Plot the data for Redium Remaining (y-axis) and Age in Years (x-axis, count by 10,000) on a second graph. Be sure to label the axes with titles and numbers. Data: See attached Data Table and Graphs. Science 8 Unit 3 Matter Name: ______________________________ Date: ______________ Period: __________ LAB – Radioactive Decay Data table for Radioactive Decay DATA Living Animal Time Trial 1 Time Trial 2 Time Trial 3 Time Trial 4 Time Trial 5 Time Trial 6 Redium Remaining 32 Goldium Remaining 0 ANALYSIS Number of Age Half-Lives in Years 0 0 Redium Decay into Goldium Redium Remaining vs. Age in Years
