Measures of Dispersion & Central Tendency
advertisement
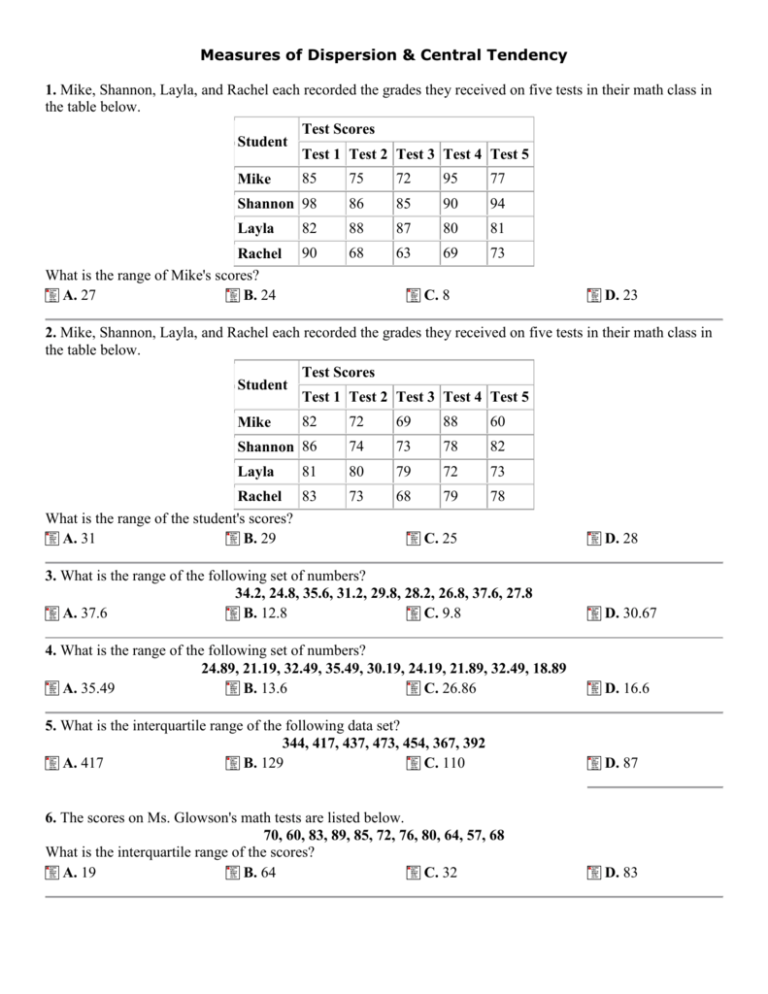
Measures of Dispersion & Central Tendency 1. Mike, Shannon, Layla, and Rachel each recorded the grades they received on five tests in their math class in the table below. Test Scores Student Test 1 Test 2 Test 3 Test 4 Test 5 85 75 72 95 77 Shannon 98 86 85 90 94 82 88 87 80 81 90 68 63 69 73 Mike Layla Rachel What is the range of Mike's scores? A. 27 B. 24 C. 8 D. 23 2. Mike, Shannon, Layla, and Rachel each recorded the grades they received on five tests in their math class in the table below. Test Scores Student Test 1 Test 2 Test 3 Test 4 Test 5 82 72 69 88 60 Shannon 86 74 73 78 82 81 80 79 72 73 Rachel 83 What is the range of the student's scores? A. 31 B. 29 73 68 79 78 Mike Layla C. 25 D. 28 3. What is the range of the following set of numbers? 34.2, 24.8, 35.6, 31.2, 29.8, 28.2, 26.8, 37.6, 27.8 A. 37.6 B. 12.8 C. 9.8 D. 30.67 4. What is the range of the following set of numbers? 24.89, 21.19, 32.49, 35.49, 30.19, 24.19, 21.89, 32.49, 18.89 A. 35.49 B. 13.6 C. 26.86 D. 16.6 5. What is the interquartile range of the following data set? 344, 417, 437, 473, 454, 367, 392 A. 417 B. 129 C. 110 D. 87 6. The scores on Ms. Glowson's math tests are listed below. 70, 60, 83, 89, 85, 72, 76, 80, 64, 57, 68 What is the interquartile range of the scores? A. 19 B. 64 C. 32 D. 83 7. What is the interquartile range of the following data set? 43, 52, 53, 58, 54, 47, 47 A. 7 B. 11 C. 47 D. 52 8. The points scored by Melissa in eleven basketball games are listed below. 17, 9, 29, 32, 31, 20, 23, 25, 11, 5, 14 What is the interquartile range of the scores? A. 11 B. 18 C. 27 D. 29 9. Every year the county fair holds a grape-eating contest. The numbers of grapes eaten by thirteen contestants in 30 seconds are listed below. 66, 55, 79, 87, 83, 68, 72, 77, 60, 53, 64, 66, 79 What is the interquartile range of the set of data? A. 17 B. 19 C. 34 D. 15 10. What is the interquartile range of the set of data given below? 66, 54, 81, 88, 86, 69, 73, 78, 59, 51, 63, 66, 86 A. 18 B. 22 C. 37 D. 22.5 11. What is the lower quartile, Q1, of the following data set? 42, 39, 31, 49, 53, 62, 27, 62, 35, 57, 45, 22, 38, 46, 22 A. 31 B. 55 C. 49 D. 56 12. What is the upper quartile, Q3, of the following data set? 53, 49, 43, 61, 63, 70, 42, 66, 45, 64, 57, 36, 46, 60, 40 A. 61 B. 62 C. 63 D. 66 13. What is the mode of the following set of numbers? 72.6, 75, 32.65, 72.6, 75, 190, 72.6, 34.5, 34.5 A. 190 B. 34.5 C. 32.65 D. 72.6 14. What is the mode of the following set of numbers? 60.1, 67, 5, 60.1, 67, 121.04, 67, 115, 5, 115 A. 67 B. 60.1 C. 121.04 D. 5 15. What is the median of the following set of numbers? 51.9 , 50 , 44 , 50 , 45.1 , 42.1 , 47 , 54.9 , 39.1 A. 47 B. 51.9 C. 44 D. 54.9 16. What is the median of the following set of numbers? 40.2 , 37 , 42.2 , 39 , 37 , 37.8 , 35.8 , 44.2 , 41 A. 33.8 B. 37 C. 39 D. 35.8 17. What is the median of the following set of numbers? 83, 148, 160, 100, 202, 122, 132, 114, 174, 188 A. 141 B. 132 C. 140 D. 148 18. What is the mean of the following set of numbers? [Round the answer to the hundredths place if needed.] 8, 8.03, 12, 11.46, 6, 45, 8.27, 23 A. 17.39 B. 8 C. 45 D. 15.22 19. What is the mean of the following set of numbers? 11.82, 14, 7.04, 20 A. 6.6075 B. 7.04 C. 13.215 D. 12.96 20. What is the mean of the following set of numbers? [Round the answer to the hundredths place if needed.] A. 14.85 B. 18.45 C. 11.88 D. 6.9 21. A company conducted a survey of 6,216 people to find out the fastest speed they have driven in certain cities. Based on the table below, what is the difference between sample's interquartile range and the population's interquartile range? Name Minimum 1st Quartile 2nd Quartile 3rd Quartile Maximum Macon 70 85 93 103 110 Augusta 68 78 98 107 112 Decatur 74 81 86 99 105 Jefferson 74 88 89 107 115 Population 68 77 98 106 123 A. There is a difference of 8. B. There is a difference of 5. C. There is a difference of 12.2. D. There is a difference of 11. 22. The table below represents the students' statistics on their weekly quizzes throughout the year. The table shows four students randomly selected from the class and the class as a whole. What is the difference between the average sample interquartile range and the population? Name Minimum 1st Quartile 2nd Quartile 3rd Quartile Maximum Robert 48 51 55 75 82 Theresa 38 53 60 69 84 Justin 45 53 65 72 77 Roberta 43 49 62 74 87 Population 36 44 64 79 92 A. There is a difference of 13. C. There is a difference of 18.2. B. There is a difference of 14. D. There is a difference of 15. 23. Angela recorded the ages of the people in sales and the people in accounting at her company below. Sales: 29, 28, 26, 33, 37, 34, 31 Accounting: 35, 38, 36, 33, 39, 43, 41 How does the interquartile range of the ages of the people in sales compare to the interquartile range of the ages of the people in accounting? A. The interquartile range for sales is 6 years less than the interquartile range for accounting. B. The interquartile range for sales is 7 years greater than the interquartile range for accounting. C. The interquartile ranges for sales and accounting are both 6 years. D. The interquartile ranges for sales and accounting are both 7 years. 24. Robert and Blake are both competitive hot dog eaters. The results of the last seven hot dog eating competitions are listed below. Robert: 7, 10, 6, 11, 5, 7, 8 Blake: 16, 11, 18, 8, 15, 15, 12 How does the interquartile range of the number of hot dogs Blake ate compare to the interquartile range of the number of hot dogs Rob ate? A. Blake's interquartile range is equal to Rob's interquartile range. B. Blake's interquartile range is one hot dog greater than Robert's interquartile range. C. Blake's interquartile range is one hot dog less than Rob's interquartile range. D. Blake's interquartile range is two hot dogs greater than Rob's interquartile range. 25. Matt and Linda each start the year with 15 vacation days. The table below shows how many vacation days each of them had left at the end of each quarter. Jan. - Mar. Apr. - June July - Sept. Oct. - Dec. Matt 13 12 11 9 9 8 0 Linda 12 What is the difference between the interquartile ranges of Matt's remaining vacation days and Linda's remaining vacation days? A. 8 days B. 4 days C. 3 days D. 4.4 days 26. Kathleen has gathered all of her test scores for the semester. As a comparison, she asked her friend Joey for her test scores and put them into the table below. Test Scores Kathleen 66 80 87 58 92 76 78 79 Joey 74 86 84 70 94 77 74 52 How does the range of Kathleen's test scores compare to the range of Joey's test scores? A. The range of Kathleen's scores is less than the range of Joey's scores by 12 points. B. The range of Kathleen's scores is greater than the range of Joey's scores by 6 points. C. The range of Kathleen's scores is greater than the range of Joey's scores by 8 points. D. The range of Kathleen's scores is less than the range of Joey's scores by 8 points. 27. Michael and Stanley both work for the same company in sales. Their supervisor announced that the salesperson with the highest cumulative sales numbers over the last six months will receive a bonus. Below is a table showing the worth of the goods sold by Michael and Stanley for each of the last six months. March April May June July August Michael $57,086.00 $63,698.00 $68,675.00 $58,377.00 $54,965.00 $45,616.00 Stanley $34,045.00 $43,262.00 $40,485.00 $48,413.00 $41,693.00 $45,475.00 How does the range of Michael's sales numbers compare to the range of Stanley's sales numbers? A. The range of Michael's sales numbers is greater than the range of Stanley's sales numbers by $5,677.00. B. The range of Michael's sales numbers is less than the range of Stanley's sales numbers by $8,883.00. C. The range of Michael's sales numbers is greater than the range of Stanley's sales numbers by $8,691.00. D. The range of Michael's sales numbers is less than the range of Stanley's sales numbers by $8,691.00. 28. Jim made the graph below to compare the boxes of paper sold by salespeople in his branch in Akron to the boxes of paper sold by salespeople in the national corporation to which his branch belongs. How does the lower quartile of boxes sold in Akron compare to the upper quartile of boxes sold nationally? A. The lower quartile of boxes sold in Akron is less than the upper quartile of boxes sold nationally. B. The lower quartile of boxes sold in Akron is three times as large as the upper quartile of boxes sold nationally. C. The lower quartile of boxes sold in Akron is greater than the upper quartile of boxes sold nationally. D. The lower quartile of boxes sold in Akron is in the same range as the upper quartile of boxes sold nationally. 29. In the Lake Woods area, there are three different neighborhoods: Waterspring, West Woods, and Williams Creek. The number of houses on each street in each neighborhood is given in the table below. Street 1 Street 2 Street 3 Street 4 Street 5 Waterspring 10 12 8 11 12 West Woods 9 9 14 16 7 5 8 7 6 Williams Creek 6 How does the lower quartile of Waterspring compare with the lower quartile of West Woods? A. The lower quartile of Waterspring is greater than the lower quartile of West Woods. B. The lower quartile of Waterspring is two times the lower quartile of West Woods. C. The lower quartile of Waterspring is less than the lower quartile of West Woods. D. The lower quartile of Waterspring is equal to the lower quartile of West Woods. 30. George made the table below that shows how far his family members and coworkers travel to get to work. Family 9 mi. 17 mi. 20 mi. 24 mi. 32 mi. 36 mi. 39 mi. 40 mi. Coworkers 12 mi. 17 mi. 21 mi. 29 mi. 32 mi. 38 mi. 38 mi.</font. 44 mi. What is the difference between the lower quartile of the distances to work for George's family members and the upper quartile of the distances to work for George's coworkers? A. 31 mi. B. 30 mi. C. 27.5 mi. D. 19.5 mi. 31. Raquel and Simon both ride their bicycles to school and leave their houses at the same time. The time it took each of them to bike to school from Monday through Thursday is recorded in the table below. Mon. Tues. Wed. Thurs. Raquel 17 min 22 min 18 min 19 min Simon 14 min 13 min 15 min. 18 min Based on their mean times, which statement best describes how Raquel and Simon will most likely arrive at school on Friday? A. Raquel and Simon will most likely arrive at the same time. B. Simon will most likely arrive 4 minutes after Raquel arrives. C. Raquel will most likely arrive 9 minutes after Simon arrives. D. Raquel will most likely arrive 4 minutes after Simon arrives. 32. Mr. and Mrs. Nelson have decided they are going to send their son, Christopher, to a private high school. They will make their decision based on a rating system where 1 point is the lowest score a school can receive and 20 points is the highest. Below are the ratings received by the schools over a five-year period. 2002 2003 2004 2005 2006 Sunlight Academy 12 11 14 13 10 Shadow Ridge 17 14 11 12 16 Preparatory Based on the mean of the ratings, which school should the Nelsons choose and why? A. Sunlight Academy, because its mean rating is 2 points higher. B. Shadow Ridge Preparatory, because its mean rating is 3 points higher. C. Shadow Ridge Preparatory, because its mean rating is 2 points higher. D. Sunlight Academy, because its mean rating is 3 points higher. 33. In Mrs. Roberge's fifth grade class, the students are measuring and recording their heights. The heights of five girls and five boys in the class are recorded in the table below. Students' Heights Girls 49 inches 46 inches 50 inches 46 inches 49 inches Boys 43 inches 47 inches 46 inches 41 inches 43 inches Which statement best describes the means of the two sets of data? A. The mean of the boys' heights is 4 inches greater than the mean of the girls' heights. B. The mean of the girls' heights is the same as the mean of the boys' heights. C. The mean of the girls' heights is 4 times greater than the mean of the boys' heights. D. The mean of the girls' heights is 4 inches greater than the mean of the boys' heights. 34. Below are the average test scores of two different math class periods. Test 1 Test 2 Test 3 Test 4 Test 5 Test 6 4th period 85 78 82 77 84 77 88 95 97 95 92 6th period 93 How do the median test scores of each class period compare? A. The median test score of 6th period is greater than the median test score of 4th period by 14 points. B. The median test score of 6th period is greater than the median test score of 4th period by 13 points. C. The median test score of 4th period is equal to the median test score of 6th period. D. The median test score of 4th period is greater than the median test score of 6th period by 14 points. 35. As part of a project for their science class, Sydney and Gabrielle each measured the temperature of the water in their own pools each day from Monday through Friday. The first part of the project was to make a data table, so Sydney and Gabrielle made the table below. Mon. Tues. Wed. Thurs. Fri. Sydney's Pool 62°F 65°F 66°F 61°F 70°F Gabrielle's Pool 65°F 74°F 57°F 75°F 58°F The second part of the project was to answer the question, "How is the median of the first set of data different from the median of the second set of data?" Which of the responses below best answers this question? A. The median of the first set of data is greater than the median of the second set of data. B. The median of the first set of data is less than the median of the second set of data. C. The median of the first set of data is half the median of the second set of data. D. The median of the first set of data is the same as the median of the second set of data. 36. There are 30 students in student council and 300 students in ninth grade at Northwest High School. The histograms below give information about the number of cans of food contributed to the Fall Food Drive at Northwest High School by each of the students in student council and by each of the students in ninth grade. Which statement best compares the medians of the data in the histograms? A. The median number of cans donated by each student in student council is ten times less than the median number of cans donated by each student in ninth grade. B. The median number of cans donated by each student in student council is equal to the median number of cans donated by each student in ninth grade. C. The median number of cans donated by each student in student council is less than the median number of cans donated by each student in ninth grade. D. The median number of cans donated by each student in student council is greater than the median number of cans donated by each student in ninth grade. 37. Maria is completing a survey to use for a project in her statistics class. She went to two local stores and asked 10 randomly selected patrons to give their ages. The data she collected is shown below. Store 1 36 24 19 20 33 24 9 54 24 33 Store 2 77 57 65 87 66 77 77 65 83 89 How does the mode of Maria's data at Store 1 differ from the mode at Store 2? A. The mode of Maria's data at Store 1 is less than the mode at Store 2 by 32. B. The mode of Maria's data at Store 1 is greater than the mode at Store 2 by 53. C. The mode of Maria's data at Store 1 is less than the mode at Store 2 by 53. D. The mode of Maria's data at Store 1 is greater than the mode at Store 2 by 32. 38. To prepare for an upcoming marathon, John and Luke have been running several miles each day. As a comparison, they have recorded the time it has taken them to run one mile on each of the last seven days on the table below (times are shown in seconds). John 636 584 563 616 593 597 553 Luke 613 552 540 573 520 552 603 How does the mode of John's data compare to the mode of Luke's data? A. There is no mode for John's data, while the mode of Luke's data is 552. B. The mode of John's data is greater than the mode of Luke's data by 41. C. The mode of John's data is less than the mode of Luke's data by 41. D. The mode of John's data is 584, while there is no mode for Luke's data. Answers 1. D 2. D 3. B 4. D 5. D 6. A 7. A 8. B 9. A 10. D 11. A 12. C 13. D 14. A 15. A 16. C 17. C 18. D 19. C 20. A 21. A 22. B 23. C 24. B 25. B 26. D 27. C 28. A 29. A 30. D 31. D 32. C 33. D 34. A 35. D 36. D 37. C 38. A
