L 12 In-circuit measurements
advertisement
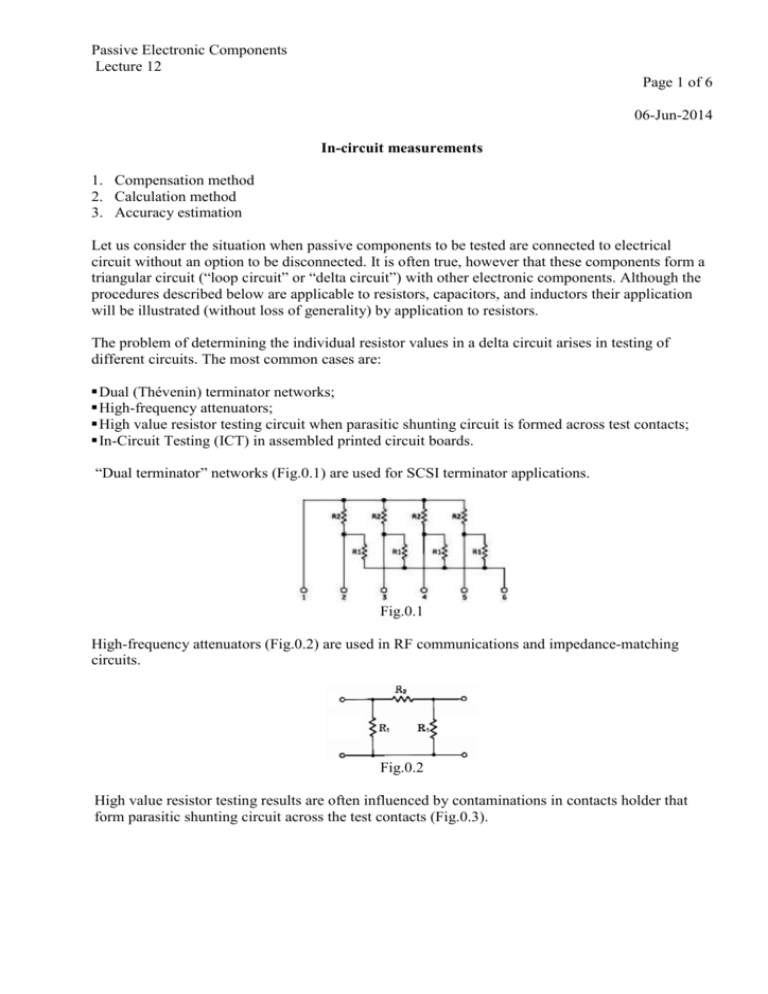
Passive Electronic Components Lecture 12 Page 1 of 6 06-Jun-2014 In-circuit measurements 1. Compensation method 2. Calculation method 3. Accuracy estimation Let us consider the situation when passive components to be tested are connected to electrical circuit without an option to be disconnected. It is often true, however that these components form a triangular circuit (“loop circuit” or “delta circuit”) with other electronic components. Although the procedures described below are applicable to resistors, capacitors, and inductors their application will be illustrated (without loss of generality) by application to resistors. The problem of determining the individual resistor values in a delta circuit arises in testing of different circuits. The most common cases are: Dual (Thévenin) terminator networks; High-frequency attenuators; High value resistor testing circuit when parasitic shunting circuit is formed across test contacts; In-Circuit Testing (ICT) in assembled printed circuit boards. “Dual terminator” networks (Fig.0.1) are used for SCSI terminator applications. Fig.0.1 High-frequency attenuators (Fig.0.2) are used in RF communications and impedance-matching circuits. Fig.0.2 High value resistor testing results are often influenced by contaminations in contacts holder that form parasitic shunting circuit across the test contacts (Fig.0.3). Passive Electronic Components Lecture 12 Page 2 of 6 Fig.0.3 Fig.0.4 Resistance measurement in resistor mounted on PCB during In-Circuit Testing (Fig.0.4). In all considered examples resistor under test is shunted by other resistors or by construction elements forming “delta” (“loop”) resistive network. Therefore, direct resistance measurement may result in significant error. There are two approaches to the problem solution: compensation method; calculation method. 1. Compensation method The method is based on the use of a “guard driver” – the operational amplifier that compensates for the influence of shunting brunch in a delta-circuit [1]. _ + I x H I2 V Z2 I1 Z1 Z 3 G I3 L Fig. 1.1 Resistors Z1 , Z2 , Z3 form a delta circuit, as shown in Fig.1.1. Suppose that the value of resistor Z1 has to be measured. The meter circuit, with terminals H and L consists of a current source and Passive Electronic Components Lecture 12 Page 3 of 6 voltmeter that are connected across resistor Z1. The guard driver with terminals H and G is an operational amplifier configured as a voltage follower. It is connected across resistor Z2 and serves to equalize the potentials at terminals H and G. Since the voltage across resistor Z2 is zero, the current through that resistor is also zero. Assuming that the input currents of the operational amplifier and voltmeter are negligible, we come to conclusion that measurement current I passes only through resistor Z1 , as if it were not shunted by the resistors Z2 and Z3. Unlike the ideal guard driver, the real ones may have some finite voltage x across terminals H and G (offset voltage). The offset voltage x forces the current I to split into the measuring current I1 and the bypass current I2= x / Z2 , creating the relative measurement error I2 / I = x / (IZ2). The smaller the value of Z2 , the grater the error. To keep the relative measurement error below a given minimum resistance Z2 must be restricted as follows: Z2 x I (1.1) Suppose that the operational amplifier is ideal (x = 0, I = I1, I3 is equal to output current of amplifier). It follows from equality of potentials of terminals H and G that I1Z1 = I3Z3 . Remembering that I = I1 we can conclude that Z3 = IZ1 / I3. The output current of operational amplifier is limited. Suppose that the limit is Imax. We can establish minimum value of Z3 that does not result in overload of amplifier and therefore guard driver error by replacing I3 with Imax in the last equation: Z3 I Z1 I max (1.2) Commonly there are additional sources of error related to operational amplifier: input bias current, common mode rejection ratio (CMRR), etc. The standard meter, in conjunction with the guard driver, forms a measuring system. The guard driver contributes to the total measurement error. As a result, the whole measuring system must be calibrated before making the resistance measurements regardless of the fact that calibrated meter is used. The measured object – the delta circuit – has 3 independent parameters: Z1 , Z2 , Z3 . At the same time, the meter is equipped with several measurement ranges to cover all likely values of the resistances. Considering all combinations of Z1 , Z2 , Z3 values and respective meter ranges, we must conclude that the calibration procedure tends to become unduly lengthy and tedious. 2. Calculation method An attractive alternative method is a combination of conventional (non-guarded) resistance measurements and calculations [2]. Three resistance measurements, R12 , R23 , R13 , are made across the terminals of the delta circuit as shown in Fig. 1.2. Passive Electronic Components Lecture 12 Page 4 of 6 R13 Z13 1 33 Z23 Z12 R23 R12 2 2 Fig. 1.2 1 1 R1 R3 3 3 R2 22 Fig. 1.3 A conventional meter, with no calibration problems, is appropriate for this purpose. Three measured resistance values will serve as input data for subsequent calculations. The actual Z12 , Z23 , Z13 resistance values have to be found. It is obvious from Fig. 1.2 that R12 Z 12 Z 23 Z 13 / Z 12 Z 23 Z 13 R23 Z 23 Z 12 Z 13 / Z 12 Z 23 Z 13 (1.3) R13 Z 13 Z 23 Z 12 / Z 12 Z 23 Z 13 An efficient way to solve non-liner equations (1.3) with respect to Z12 , Z23 , Z13 is a change of variables by replacing the delta circuit by the equivalent wye circuit shown in Fig.1.3. The corresponding equations for the wye-delta circuit transformation are as follows [3]: Z 12 R1 R 2 R1 R3 R 2 R3 / R3 Z 23 R1 R 2 R1 R3 R 2 R3 / R1 Z 13 R1 R 2 R1 R3 R 2 R3 / R 2 (1.4) Next, the values of R1 , R2 , R3 in equations (1.4) must be expressed in terms of the measured resistances R12 , R23 , R13 by solution the following linear equations. Passive Electronic Components Lecture 12 Page 5 of 6 R12 R1 R2 ; R23 R2 R3 ; R13 R1 R3 . The final relationships for the delta circuit resistances are [2]: R12 R23 R13 2 2R122 R232 R132 2R 23 R13 R12 R R23 R13 2 2R122 R232 R132 Z 23 12 2R13 R12 R 23 R R23 R13 2 2R122 R232 R132 Z 13 12 2R12 R 23 R13 Z 12 (1.5) There is a hidden potential problem in the practical use of equations (1.5). Under certain circumstances, negligible measurement error in the values of R12 , R23 , R13 can be transformed into significant errors in the calculated values of Z12 , Z23 , Z13 . This happens when resistances of delta circuit components have greatly different values. 3. Accuracy estimation The calculation method is a two-step process. The first step consists of the resistance measurements across the terminals of the delta circuit, and involves no specific calibration problem, since both the meter and the measurement procedure are standard. The problem arises in the second (calculation) step where an increase in the measurement error can occur [4]. Let us illustrate it by numerical modeling. 1. Suppose that the actual resistances in the delta circuit (Fig.1.2) are: Z12 = 87.0000 kΩ, Z23 = 11.5000 kΩ, Z13 = 1.10000 kΩ. 2. Let us neglect all kinds of measurement error except the rounding in digital instrument. Measurement of seeming values using measurement instrument with 4-digits display will result according to (1.3) in: R12 = 11.01 kΩ , R23 = 10.17 kΩ, R13 = 1.088 kΩ . 3. Backward calculation of Z12 per (1.5) is shown below: R12 R23 R13 11.01 10.17 1.088 22.26(8) 2 R122 R23 R132 R12 R23 R13 2 2R122 R232 R132 R23 R13 R12 495.8(638) -451.6(6549) 44.1(983) 10.17 1.088 -11.01 0.24(8) 121.2(201) 103.4(289) 1.183(744) 225.8(327) Z12 44.1983 89.10955 89k 2 0.248 Passive Electronic Components Lecture 12 Page 6 of 6 The error of calculation method in this case exceeds 2% regardless 0.05% precision of initial data that results from resistance measurement results. Calculation results that correspond to use of ohmmeters with different numbers of digits in display (different instrument precision) are the following: Display capacity (digits) 2 3 4 5 6 Z12 error, % 152 -12.0 2.42 0.0485 -0.0134 Calculation method makes it possible to use regular and easy calibrated ohmmeters. The error of method may be estimated in advance analytically [4] or by using of numerical modeling. Literature 1. Schwertner, T., Leutbecher, K., Obtaining more accurate resistance measurements using 6-wire Ohms measurement technique, CARTS-EUROPE’97 Symposium Proc., pp. 56-66. 2. Shen Da-xun, Tian Cheng-feng, A new method of in-circuit measurement of resistance, Chinese Journal of Scientific Instruments, 1998, Vol. 19, No. 3. 3. Tocci, R.J., Introduction to electric circuit analysis, Charles E. Merrill Publishing Co., Columbus, Ohio, 1974, 842 p. 4. Belman M., Reliable in-circuit evaluation of passive electronic components. CARTS 2001 (21th Capacitor and Resistor Technology Symposium) Proc., pp. 192-197.


