Registration in Developmental Education Courses
advertisement
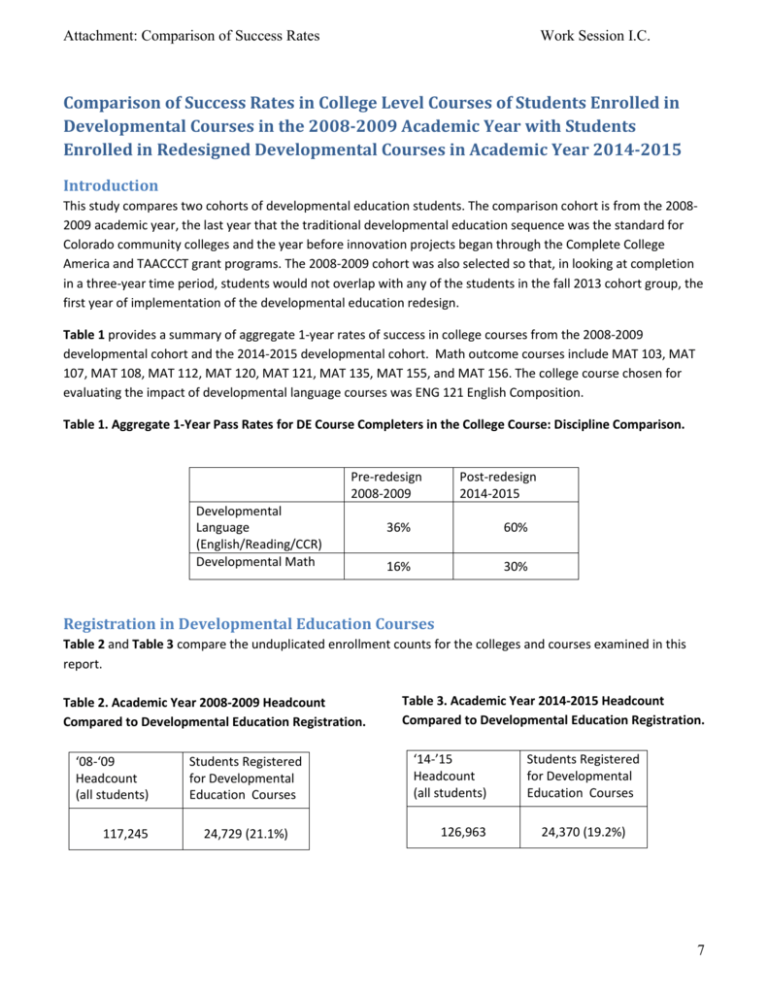
Attachment: Comparison of Success Rates Work Session I.C. Comparison of Success Rates in College Level Courses of Students Enrolled in Developmental Courses in the 2008-2009 Academic Year with Students Enrolled in Redesigned Developmental Courses in Academic Year 2014-2015 Introduction This study compares two cohorts of developmental education students. The comparison cohort is from the 20082009 academic year, the last year that the traditional developmental education sequence was the standard for Colorado community colleges and the year before innovation projects began through the Complete College America and TAACCCT grant programs. The 2008-2009 cohort was also selected so that, in looking at completion in a three-year time period, students would not overlap with any of the students in the fall 2013 cohort group, the first year of implementation of the developmental education redesign. Table 1 provides a summary of aggregate 1-year rates of success in college courses from the 2008-2009 developmental cohort and the 2014-2015 developmental cohort. Math outcome courses include MAT 103, MAT 107, MAT 108, MAT 112, MAT 120, MAT 121, MAT 135, MAT 155, and MAT 156. The college course chosen for evaluating the impact of developmental language courses was ENG 121 English Composition. Table 1. Aggregate 1-Year Pass Rates for DE Course Completers in the College Course: Discipline Comparison. Pre-redesign 2008-2009 Developmental Language (English/Reading/CCR) Developmental Math Post-redesign 2014-2015 36% 60% 16% 30% Registration in Developmental Education Courses Table 2 and Table 3 compare the unduplicated enrollment counts for the colleges and courses examined in this report. Table 2. Academic Year 2008-2009 Headcount Compared to Developmental Education Registration. ‘08-‘09 Headcount (all students) 117,245 Students Registered for Developmental Education Courses 24,729 (21.1%) Table 3. Academic Year 2014-2015 Headcount Compared to Developmental Education Registration. ‘14-’15 Headcount (all students) 126,963 Students Registered for Developmental Education Courses 24,370 (19.2%) 7 Attachment: Comparison of Success Rates Work Session I.C. Table 4 and Table 5 show course registrations in developmental education courses for the 2008-2009 academic year and redesigned courses for the 2014-2015 academic years, respectively. Since students may take (or re-take) more than one developmental course in an academic year, Tables 4 and 5 count registrations at the course level rather than unique students. Later tables in this report will also show unique student counts at the course level and in aggregate. Table 4. Registration in Developmental Education Courses 2008-2009. Course ENG 030 Registration Count 691 ENG 060 3,073 ENG 090 REA 030 REA 060 REA 090 MAT030 MAT060 MAT090 MAT099 Total 9,764 662 2,545 4,119 7,629 9,027 8,833 636 46,979 Table 5. Registration in Redesigned Developmental Education Courses 2014-2015. Course CCR 091* CCR 092 CCR093 CCR 094 MAT 025* MAT 050 MAT 055 MAT 091 MAT 092 MAT 093 Other Math1 Total Registration Count 155 5,458 842 5,214 1,666 11,121 9,084 211 12 140 1,960 35,863 * CCR 091 and MAT 025 are intended as supplemental courses for CCR 092 and MAT 055, respectively. Completion Rates for Students in Reading and Writing Courses Prior to the redesign of developmental education, Colorado community colleges had separate developmental courses for reading and writing. Students who did not demonstrate college readiness in reading enrolled in one of three courses in the REA discipline, REA 030, 060, or 090. Students who did not demonstrate college readiness in writing skills enrolled in one of three courses in the ENG discipline, ENG 030, 060, or 090. Tables 6 and 7 (next page) report on the outcomes for students who were enrolled in developmental reading and writing courses in the 2008-2009 academic year, their success in those courses, and their enrollment and success (defined as receiving a “C” or better) in college-level courses within the academic year following their developmental course (for example, if a student took ENG 060 in Spring 2009, they were counted if they enrolled in a college-level course that term, during the summer, or in the subsequent Fall semester). The specific collegelevel courses examined in this report are a composition course (ENG 121) and courses qualifying for Guaranteed Transfer credit (gtPathways courses). 1 Other math courses offered in 2014-2015 include MAT 045, MAT 060, MAT 090, and MAT 070-087. These courses are not part of the final redesign sequence and were offered in a limited capacity during the 2014-2015 academic year. 8 Attachment: Comparison of Success Rates Work Session I.C. Table 6. Completion of College-Level English (ENG 121) in One Academic Year for Students Enrolled in Developmental Reading and Developmental English 2008-2009. Students enrolled …successfully …successfully Course in developmental completed the completed ENG 121 in course course the following year ENG 030 664 452 (68%) 22 (5%) ENG 060 2,947 2,058 (70%) 439 (21%) ENG 090 9,302 6,225 (67%) 2,923 (47%) REA 030 642 459 (71%) 56 (12%) REA 060 2,436 1,737 (71%) 435 (25%) REA 090 3,987 2,721 (68%) 1,058 (39%) 13,406 9,465 (71%) 3,417 (36%) All DE Language2 Table 7. Completion of a gtPathways Course in One Academic Year for Students Enrolled in Developmental Reading and Developmental English 2008-2009. Course Students enrolled in developmental course …successfully completed the course …successfully completed a gtPathways Course in the following year ENG 030 664 452 (68%) 101 (22%) ENG 060 2,947 2,058 (70%) 840 (41%) ENG 090 9,302 6,225 (67%) 3,997 (64%) REA 030 642 459 (71%) 125 (27%) REA 060 2,436 1,737 (71%) 678 (39%) REA 090 3,987 2,721 (68%) 1,531 (56%) 13,406 9,465 (71%) 5,051 (53%) All DE Language3 2 Aggregate counts are not the sum of all counts within a category, but instead reflect the number of unique students taking courses within that category. 3 Ibid. 9 Attachment: Comparison of Success Rates Work Session I.C. The redesign replaced the separate courses in reading and writing with integrated reading and writing courses, College Composition and Reading (CCR). In this model, students can complete their developmental course work in one course and in one semester. Students have three options: A five-credit developmental course that integrates reading and writing (CCR 092). A college-level discipline course plus a three-credit reading and writing co-requisite (CCR 093). Not as many CCR 093 students enroll in and complete ENG 121 because the developmental course is paired with a college-level course that the college selects and not ENG 121. Due to the co-requisite nature of the course with a college-level course, it is considered a supplemental academic instruction course. A college-level writing course (ENG 121) linked with a three-credit reading and writing co-requisite (CCR 094). Because the developmental course is paired with a college-level course, this is also considered a supplemental academic instruction course. Colleges have the option to offer a one-credit lab, CCR 091, for students whose placement scores are lower than the score needed to enroll in CCR 092. Those students must take CCR 091 concurrently with CCR 092. Table 8 reports on the students who enrolled in CCR courses in AY2014-2015. In addition to showing the number and percentage of students who were successful in the CCR developmental course, it shows how many of these students enrolled in the college writing course (ENG 121) and how many successfully completed the course by the end of summer 2015. Table 9 (next page) covers a similar time-frame, but reports completion rates for students in gtPathways courses. Table 8. Completion of a College-Level English Course (ENG 121) by Summer 2015 for Students Enrolled in College Composition and Reading (CCR) Courses in 2014-2015. Students enrolled …successfully …successfully completed Course in developmental completed the college composition ENG 121 by Summer course course 2015 CCR 091 (with CCR 092) CCR 092 (no CCR 091) CCR 093 152 105 (69%) 32 (30%) 5,029 3,316 (66%) 1,016 (31%) 812 499 (61%) 155 (31%) CCR 094 5,081 3,529 (69%) 3,273 (93%) All CCR 4 10,899 7,280 (67%) 4,381 (60%) 4 Ibid. 10 Attachment: Comparison of Success Rates Work Session I.C. Table 9. Completion of a gtPathways Course by Summer 2015 for Students Enrolled in College Composition and Reading (CCR) Courses in 2014-2015. Students enrolled …successfully …successfully completed Course in developmental completed the at least one gtPathways course by Summer 2015 course course CCR 091 152 105 (69%) 46 (44%) CCR 092 5,029 3,316 (66%) 1,420 (43%) CCR 093 812 499 (61%) 406 (81%) CCR 094 5,081 3,529 (69%) 3,322 (94%) All CCR 5 10,899 7,280 (67%) 5,077 (70%) Completion Rates for Students in Developmental Math Courses Prior to the redesign, Colorado community colleges had a four course, thirteen credit-hour sequence for developmental math: MAT 030, 060, 090, and 099. Table 10 reports on students in 2008-2009 who were enrolled in developmental math and subsequent success in a college-level math course (MAT 103, 107, 108, 112, 120, 121,123, 135, 155, or 156). Table 10. Completion of College-Level Math in One Academic Year for Students Enrolled in Developmental Math 2008-2009. Course Students enrolled in …successfully completed the …successfully completed developmental course course college level math course in the following year MAT 030 7,161 4,638 (65%) 216 (5%) MAT 060 8,570 5,848 (68%) 742 (13%) MAT 090 8,135 4,952 (61%) 1,219 (25%) MAT 099 636 309 (49%) 167 (54%) All Math6 19,107 12,343 (65%) 1,954 (16%) The Math redesign built pathways for students based on the career and educational goals of the students. Many students—based on their degree plans—need a non-transfer, career math course. Other students benefit from a college-level transfer course like Math for Liberal Arts or Statistics. The math these students need is different from the math necessary to succeed in a science, technology, energy, or math (STEM) degree which generally require algebra and then calculus. Therefore, the developmental preparation courses that these students take should also be different. 5 6 Ibid. Ibid. 11 Attachment: Comparison of Success Rates Work Session I.C. To meet this need, the Colorado redesign offers two different developmental courses for math. One option is a Quantitative Literacy class (MAT 050) designed to develop skills students need to be successful in either a nontransfer career math course or in a transferable but non-STEM math course. The second option is an Algebraic Literacy course (MAT 055) for students who need College Algebra either because they are pursuing a STEM path or because their programs of study require College Algebra. Table 11 tracks the outcomes of the AY2014-2015 students who enrolled in redesigned math courses. Outcomes include successful completion of the developmental course, enrollment in a college-level math course, and success in the college-level course through the subsequent semester, summer 2015. Table 11. Completion of College-Level Math Courses by Summer 2015 for Students Enrolled in Redesigned MAT Courses in 2014-2015. Course Students enrolled in …successfully completed …successfully completed the course college level math course developmental course MAT 025 1,593 1,045 (66%) 217 (21%) MAT 050 10,437 6,686 (64%) 741 (11%) MAT 055 6,870 5,166 (75%) 1,377 (27%) MAT 091 210 129 (61%) 101 (78%) MAT 092 12 11 (92%) 10 (91%) MAT 093 137 95 (69%) 78 (82%) 1,872 1,216 (65%) 273 (22%) 18,576 8,201 (44%) 2,437 (30%) Other DE Math All DE Math 7 One of the observations about the students in math is that they are not progressing from the MAT 050 course directly into a college-level class. Rather, they seem to be moving into MAT 055 rather than into a college-level math course for their program of study. While not intended in the redesign, it is not clear if this course taking pattern is a result of advising or math department intervention and merits additional study. The developmental education redesign gives the colleges the option of offering one-credit lab courses (MAT 091, 092, and 093) to support college-level math courses. These labs are designed for students whose placement scores are slightly below the scores needed for the college-level courses. Because these students are also enrolled in a co-requisite college-level math course, the labs are classified as supplemental academic instruction (SAI). This SAI in math is an option under the developmental education redesign but is not a required component of implementation. The non-required element has caused fewer campuses to implement and explains the very low enrollment numbers. 7 Ibid. 12 Attachment: Comparison of Success Rates Work Session I.C. Summary Student FTE in the developmental education redesign has decreased. This is consistent with the philosophy of the redesign that colleges should place students in college-level courses with support wherever possible rather than place them in pre-requisite developmental coursework. Students enrolled in co-requisite or SAI courses in both CCR and in math show much higher success rates in college-level courses after a year than students who are in standalone developmental education courses. However, supplemental math instruction is not yet offered at all colleges, leading to a less representative and a smaller sample. As such, there is not sufficient information to make a judgment yet with regard to supplemental academic instruction and math. Developmental education students in CCR appear to have a better chance of being successful in a college course if they take the developmental course they need concurrently with a college-level course (SAI). However, as students with higher placement scores are generally placed in corequisite rather than prerequisite courses, the question of what placement ranges will be optimal for encouraging student success in SAI remains open. 13
