Interpreting Data on General Intellectual Ability Tests What do the
advertisement
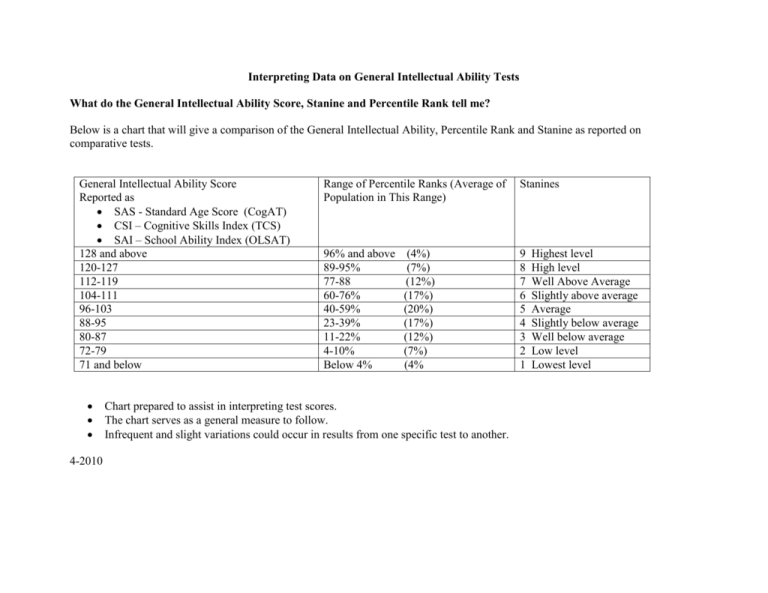
Interpreting Data on General Intellectual Ability Tests What do the General Intellectual Ability Score, Stanine and Percentile Rank tell me? Below is a chart that will give a comparison of the General Intellectual Ability, Percentile Rank and Stanine as reported on comparative tests. General Intellectual Ability Score Reported as SAS - Standard Age Score (CogAT) CSI – Cognitive Skills Index (TCS) SAI – School Ability Index (OLSAT) 128 and above 120-127 112-119 104-111 96-103 88-95 80-87 72-79 71 and below 4-2010 Range of Percentile Ranks (Average of Population in This Range) Stanines 96% and above 89-95% 77-88 60-76% 40-59% 23-39% 11-22% 4-10% Below 4% 9 8 7 6 5 4 3 2 1 (4%) (7%) (12%) (17%) (20%) (17%) (12%) (7%) (4% Chart prepared to assist in interpreting test scores. The chart serves as a general measure to follow. Infrequent and slight variations could occur in results from one specific test to another. Highest level High level Well Above Average Slightly above average Average Slightly below average Well below average Low level Lowest level
