At least 10 per cent of coastal and marine areas are conserved
advertisement
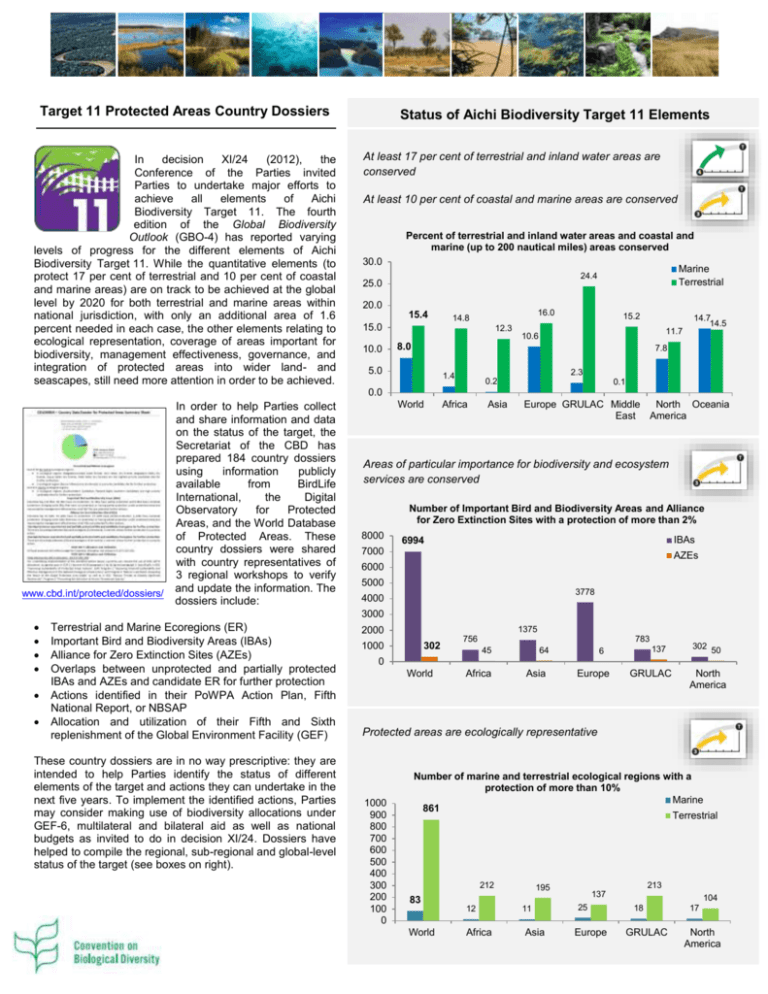
Target 11 Protected Areas Country Dossiers In decision XI/24 (2012), the Conference of the Parties invited Parties to undertake major efforts to achieve all elements of Aichi Biodiversity Target 11. The fourth edition of the Global Biodiversity Outlook (GBO-4) has reported varying levels of progress for the different elements of Aichi Biodiversity Target 11. While the quantitative elements (to protect 17 per cent of terrestrial and 10 per cent of coastal and marine areas) are on track to be achieved at the global level by 2020 for both terrestrial and marine areas within national jurisdiction, with only an additional area of 1.6 percent needed in each case, the other elements relating to ecological representation, coverage of areas important for biodiversity, management effectiveness, governance, and integration of protected areas into wider land- and seascapes, still need more attention in order to be achieved. Status of Aichi Biodiversity Target 11 Elements At least 17 per cent of terrestrial and inland water areas are conserved At least 10 per cent of coastal and marine areas are conserved Percent of terrestrial and inland water areas and coastal and marine (up to 200 nautical miles) areas conserved 30.0 20.0 15.4 16.0 14.8 15.0 10.0 Marine Terrestrial 24.4 25.0 12.3 15.2 11.7 10.6 8.0 14.7 14.5 7.8 5.0 2.3 1.4 0.2 0.1 0.0 www.cbd.int/protected/dossiers/ In order to help Parties collect and share information and data on the status of the target, the Secretariat of the CBD has prepared 184 country dossiers using information publicly available from BirdLife International, the Digital Observatory for Protected Areas, and the World Database of Protected Areas. These country dossiers were shared with country representatives of 3 regional workshops to verify and update the information. The dossiers include: World Africa Asia Europe GRULAC Middle North Oceania East America Areas of particular importance for biodiversity and ecosystem services are conserved Number of Important Bird and Biodiversity Areas and Alliance for Zero Extinction Sites with a protection of more than 2% 8000 IBAs 6994 7000 AZEs 6000 5000 3778 4000 3000 Terrestrial and Marine Ecoregions (ER) Important Bird and Biodiversity Areas (IBAs) Alliance for Zero Extinction Sites (AZEs) Overlaps between unprotected and partially protected IBAs and AZEs and candidate ER for further protection Actions identified in their PoWPA Action Plan, Fifth National Report, or NBSAP Allocation and utilization of their Fifth and Sixth replenishment of the Global Environment Facility (GEF) These country dossiers are in no way prescriptive: they are intended to help Parties identify the status of different elements of the target and actions they can undertake in the next five years. To implement the identified actions, Parties may consider making use of biodiversity allocations under GEF-6, multilateral and bilateral aid as well as national budgets as invited to do in decision XI/24. Dossiers have helped to compile the regional, sub-regional and global-level status of the target (see boxes on right). 2000 1375 1000 302 783 756 64 45 137 6 302 50 0 World Africa Asia Europe GRULAC North America Protected areas are ecologically representative 1000 900 800 700 600 500 400 300 200 100 0 Number of marine and terrestrial ecological regions with a protection of more than 10% Marine 861 Terrestrial 212 12 World Africa 213 195 83 11 Asia 137 25 Europe 104 18 GRULAC 17 North America Target 12 Threatened Species Country Dossiers Threatened species include species classified as vulnerable, endangered, or critically endangered. The fourth edition of the Global Biodiversity Outlook (GBO-4) has reported that multiple lines of evidence give high confidence that based on our current trajectory, this target would not be met by 2020 as further extinctions are likely by 2020 and the trend towards greater extinction risk for several taxonomic groups has not decelerated since 2010. The number of threatened species listed by the IUCN Red List of Threatened Species went from 15,000 species globally in 2004 to more than 19,000 species in 2014, and a recent study assessed that a sixth mass extinction is already under way1. In order to help Parties collect and share information and data on the status of Aichi Biodiversity Target 12, the Secretariat of the CBD has prepared 53 country dossiers so far using information publicly available and gathered by BirdLife International, the Digital Observatory for Protected Areas, and the IUCN Red List. These country dossiers were shared with country representatives of 3 regional workshops to verify and update the information. The dossiers include: Threatened Species identified by the IUCN Red List for various taxonomic groups Threatened Bird Species Critically Endangered Endemic Species Reducing the threat of human-induced extinction requires action to address the direct and indirect drivers of change. For instance, imminent extinctions of known threatened species can in many cases be prevented by www.cbd.int/protected/dossiers/ protecting important habitats (such as Alliance for Zero Extinction Sites) or by addressing the specific direct causes of the decline of these species (such as overexploitation, invasive alien species, pollution and disease). Achievement of this target is therefore highly dependent on most of the other Aichi Biodiversity Targets. These country dossiers are in no way prescriptive: they are intended to help Parties identify the status of different elements of the target and actions they can undertake in the next five years. Status of Aichi Biodiversity Target 12 Elements Extinction of known threatened species has been prevented The conservation status of those species most in decline has been improved and sustained Source: IUCN Red List of Threatened Species; EX – Extinct, EW – Extinct in the wild, CR – Critically Endangered, EN – Endangered, VU – Vulnerable, NT – Near Threatened, DD – Data Deficient, LC – Least Concern Taxonomic Group Mammals Birds Reptiles Amphibians Plants Number of Species Described Globally 5,515 10,425 10,038 7,391 310,442 1 Number of Critically Endangered (CR) Species 212 213 174 522 2,205 Number of Endangered (EN) Species 482 419 358 792 3,381 Number of Vulnerable (VU) Species 506 741 399 647 5,310 Number of Threatened Species (CR+EN+VU) 1,200 1,373 931 1,961 10,896 Number of Endemic Species 2,239 2,833 2,687 4,226 13,932 Number of CR Endemic Species 175 165 149 457 1,976 Ceballos, G., Ehrlich, P. R., Barnosky, A. D., García, A., Pringle, R. M., & Palmer, T. M. (2015). Accelerated modern human–induced species losses: Entering the sixth mass extinction. Science Advances, 1(5), e1400253.
