Abstract-JOINT-COST-Bertinoro-13-17-September-2015
advertisement
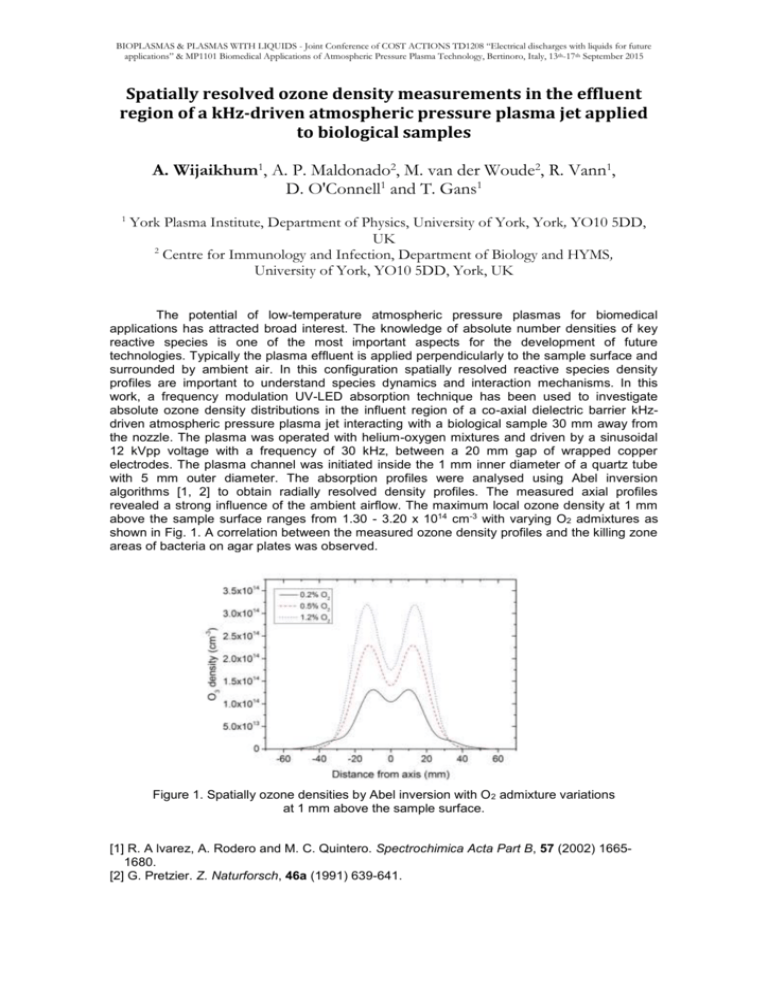
BIOPLASMAS & PLASMAS WITH LIQUIDS - Joint Conference of COST ACTIONS TD1208 “Electrical discharges with liquids for future applications” & MP1101 Biomedical Applications of Atmospheric Pressure Plasma Technology, Bertinoro, Italy, 13th-17th September 2015 Spatially resolved ozone density measurements in the effluent region of a kHz-driven atmospheric pressure plasma jet applied to biological samples A. Wijaikhum1, A. P. Maldonado2, M. van der Woude2, R. Vann1, D. O'Connell1 and T. Gans1 1 York Plasma Institute, Department of Physics, University of York, York, YO10 5DD, UK 2 Centre for Immunology and Infection, Department of Biology and HYMS, University of York, YO10 5DD, York, UK The potential of low-temperature atmospheric pressure plasmas for biomedical applications has attracted broad interest. The knowledge of absolute number densities of key reactive species is one of the most important aspects for the development of future technologies. Typically the plasma effluent is applied perpendicularly to the sample surface and surrounded by ambient air. In this configuration spatially resolved reactive species density profiles are important to understand species dynamics and interaction mechanisms. In this work, a frequency modulation UV-LED absorption technique has been used to investigate absolute ozone density distributions in the influent region of a co-axial dielectric barrier kHzdriven atmospheric pressure plasma jet interacting with a biological sample 30 mm away from the nozzle. The plasma was operated with helium-oxygen mixtures and driven by a sinusoidal 12 kVpp voltage with a frequency of 30 kHz, between a 20 mm gap of wrapped copper electrodes. The plasma channel was initiated inside the 1 mm inner diameter of a quartz tube with 5 mm outer diameter. The absorption profiles were analysed using Abel inversion algorithms [1, 2] to obtain radially resolved density profiles. The measured axial profiles revealed a strong influence of the ambient airflow. The maximum local ozone density at 1 mm above the sample surface ranges from 1.30 - 3.20 x 1014 cm-3 with varying O2 admixtures as shown in Fig. 1. A correlation between the measured ozone density profiles and the killing zone areas of bacteria on agar plates was observed. Figure 1. Spatially ozone densities by Abel inversion with O 2 admixture variations at 1 mm above the sample surface. [1] R. A lvarez, A. Rodero and M. C. Quintero. Spectrochimica Acta Part B, 57 (2002) 16651680. [2] G. Pretzier. Z. Naturforsch, 46a (1991) 639-641.

