file
advertisement
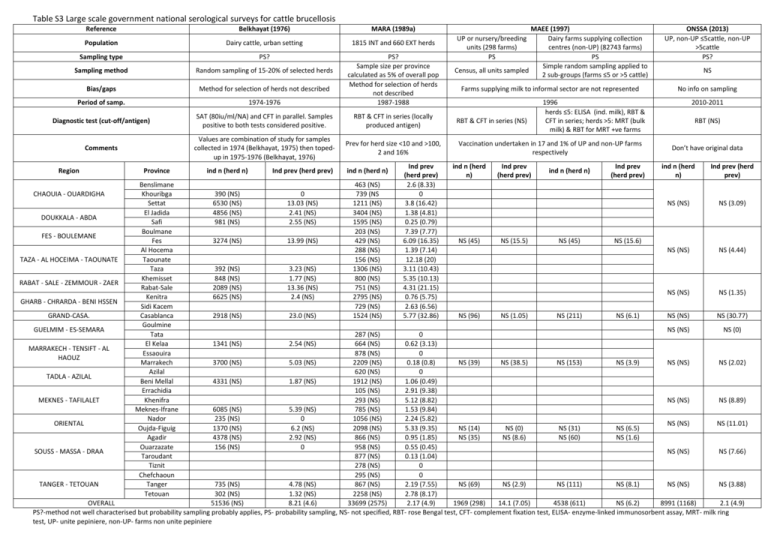
Table S3 Large scale government national serological surveys for cattle brucellosis Reference Belkhayat (1976) Population MARA (1989a) Dairy cattle, urban setting 1815 INT and 660 EXT herds Sampling type PS? Sampling method Random sampling of 15-20% of selected herds Bias/gaps Method for selection of herds not described Period of samp. 1974-1976 PS? Sample size per province calculated as 5% of overall pop Method for selection of herds not described 1987-1988 Diagnostic test (cut-off/antigen) SAT (80iu/ml/NA) and CFT in parallel. Samples positive to both tests considered positive. RBT & CFT in series (locally produced antigen) Comments Values are combination of study for samples collected in 1974 (Belkhayat, 1975) then topedup in 1975-1976 (Belkhayat, 1976) Prev for herd size <10 and >100, 2 and 16% Region CHAOUIA - OUARDIGHA DOUKKALA - ABDA FES - BOULEMANE TAZA - AL HOCEIMA - TAOUNATE RABAT - SALE - ZEMMOUR - ZAER GHARB - CHRARDA - BENI HSSEN GRAND-CASA. GUELMIM - ES-SEMARA Province Benslimane Khouribga Settat El Jadida Safi Boulmane Fes Al Hocema Taounate Taza Khemisset Rabat-Sale Kenitra Sidi Kacem Casablanca Goulmine Tata El Kelaa Essaouira Marrakech Azilal Beni Mellal Errachidia Khenifra Meknes-Ifrane Nador Oujda-Figuig Agadir Ouarzazate Taroudant Tiznit Chefchaoun Tanger Tetouan ind n (herd n) Ind prev (herd prev) 390 (NS) 6530 (NS) 4856 (NS) 981 (NS) 0 13.03 (NS) 2.41 (NS) 2.55 (NS) 3274 (NS) 13.99 (NS) 392 (NS) 848 (NS) 2089 (NS) 6625 (NS) 3.23 (NS) 1.77 (NS) 13.36 (NS) 2.4 (NS) 2918 (NS) 23.0 (NS) ind n (herd n) 463 (NS) 739 (NS 1211 (NS) 3404 (NS) 1595 (NS) 203 (NS) 429 (NS) 288 (NS) 156 (NS) 1306 (NS) 800 (NS) 751 (NS) 2795 (NS) 729 (NS) 1524 (NS) Ind prev (herd prev) 2.6 (8.33) 0 3.8 (16.42) 1.38 (4.81) 0.25 (0.79) 7.39 (7.77) 6.09 (16.35) 1.39 (7.14) 12.18 (20) 3.11 (10.43) 5.35 (10.13) 4.31 (21.15) 0.76 (5.75) 2.63 (6.56) 5.77 (32.86) MAEE (1997) Dairy farms supplying collection centres (non-UP) (82743 farms) PS Simple random sampling applied to Census, all units sampled 2 sub-groups (farms ≤5 or >5 cattle) ONSSA (2013) UP, non-UP ≤5cattle, non-UP >5cattle PS? Farms supplying milk to informal sector are not represented No info on sampling UP or nursery/breeding units (298 farms) PS RBT & CFT in series (NS) 1996 herds ≤5: ELISA (ind. milk), RBT & CFT in series; herds >5: MRT (bulk milk) & RBT for MRT +ve farms Vaccination undertaken in 17 and 1% of UP and non-UP farms respectively ind n (herd n) NS (45) NS (96) Ind prev (herd prev) NS (15.5) NS (1.05) NS ind n (herd n) NS (45) NS (211) Ind prev (herd prev) 2010-2011 RBT (NS) Don’t have original data ind n (herd n) Ind prev (herd prev) NS (NS) NS (3.09) NS (NS) NS (4.44) NS (NS) NS (1.35) NS (NS) NS (30.77) NS (15.6) NS (6.1) NS (NS) NS (0) 287 (NS) 0 664 (NS) 0.62 (3.13) MARRAKECH - TENSIFT - AL 878 (NS) 0 HAOUZ 3700 (NS) 5.03 (NS) 2209 (NS) 0.18 (0.8) NS (39) NS (38.5) NS (153) NS (3.9) NS (NS) NS (2.02) 620 (NS) 0 TADLA - AZILAL 4331 (NS) 1.87 (NS) 1912 (NS) 1.06 (0.49) 105 (NS) 2.91 (9.38) MEKNES - TAFILALET 293 (NS) 5.12 (8.82) NS (NS) NS (8.89) 6085 (NS) 5.39 (NS) 785 (NS) 1.53 (9.84) 235 (NS) 0 1056 (NS) 2.24 (5.82) ORIENTAL NS (NS) NS (11.01) 1370 (NS) 6.2 (NS) 2098 (NS) 5.33 (9.35) NS (14) NS (0) NS (31) NS (6.5) 4378 (NS) 2.92 (NS) 866 (NS) 0.95 (1.85) NS (35) NS (8.6) NS (60) NS (1.6) 156 (NS) 0 958 (NS) 0.55 (0.45) SOUSS - MASSA - DRAA NS (NS) NS (7.66) 877 (NS) 0.13 (1.04) 278 (NS) 0 295 (NS) 0 TANGER - TETOUAN 735 (NS) 4.78 (NS) 867 (NS) 2.19 (7.55) NS (69) NS (2.9) NS (111) NS (8.1) NS (NS) NS (3.88) 302 (NS) 1.32 (NS) 2258 (NS) 2.78 (8.17) OVERALL 51536 (NS) 8.21 (4.6) 33699 (2575) 2.17 (4.9) 1969 (298) 14.1 (7.05) 4538 (611) NS (6.2) 8991 (1168) 2.1 (4.9) PS?-method not well characterised but probability sampling probably applies, PS- probability sampling, NS- not specified, RBT- rose Bengal test, CFT- complement fixation test, ELISA- enzyme-linked immunosorbent assay, MRT- milk ring test, UP- unite pepiniere, non-UP- farms non unite pepiniere 1341 (NS) 2.54 (NS)

