Temburong - GeoJIS-AS
advertisement
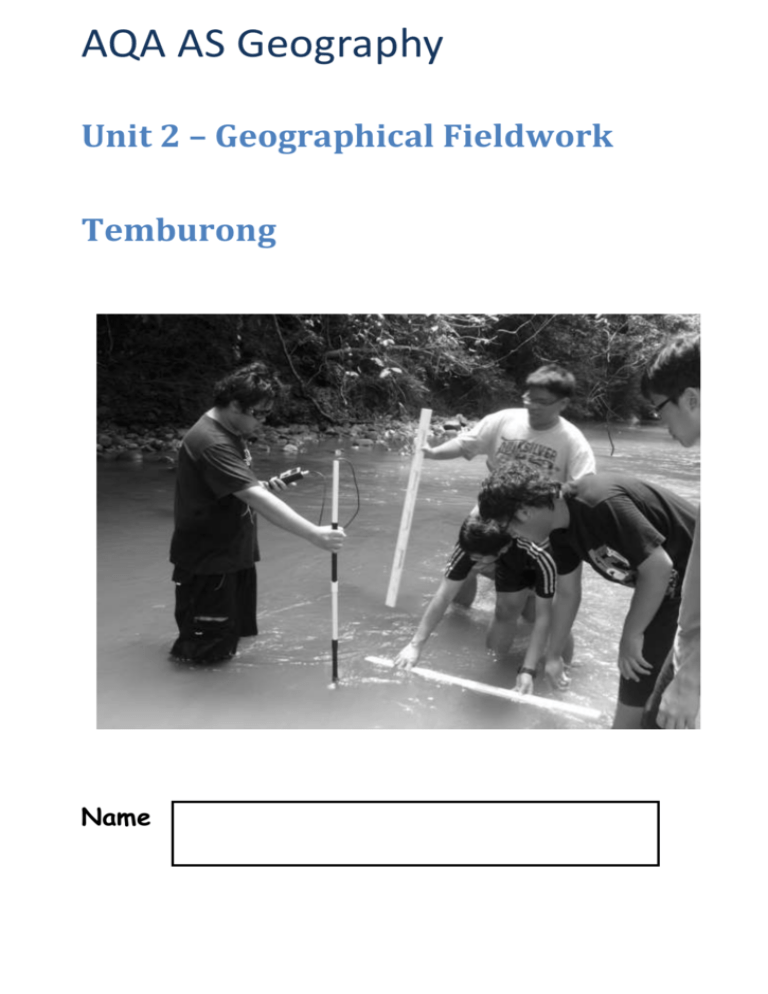
AQA AS Geography Unit 2 – Geographical Fieldwork Temburong Name Unit 2 – Geographical Skills 30% of AS, 1 hour exam 2 compulsory questions o The context of question 1 will arise from either Rivers or Population. o Question 2 will assess the geographical fieldwork that you undertake in Temburong. It is very important that you work hard during the trip – the effort that you put in during the 3 days of the trip will largely determine how well you do in the June exam. Geographical Skills There are 5 stages to Geographical enquiries in which you may be questioned on: 1. Identification of geographical questions (introduction) 2. Identification, selection and collection of quantitative and qualitative evidence from primary and secondary sources (methods) 3. Processing & presentation (Data presentation) 4. Analysis and interpretation of evidence (Data analysis) 5. Drawing conclusions and evaluation (Conclusions and Evaluation) 1) Starting off – Designing a Hypothesis Look at the box below with suggested titles for Geographical enquiries – discuss with the person next to you whether the questions are feasible or not. Title Feasible Not feasible Comments What factors influence the characteristics of a rainforest? How do soils, vegetation and land use change across a rainforest escarpment (slope)? Does Bangar fit the Burgess model of land use within a city? To investigate changes in river characteristics along the long profile of the Temburong river. The effects of tourism at the Ulu Ulu resort in Temburong. Once a title (aim) has been decided, you must break the title down into an hypotheses (for Physical investigations). These hypotheses will help you find an overall answer to the title. Fieldwork Aim Fieldwork Hypothesis Geographical Understanding of Hypothesis Bradshaw’s Model What Geographical Understanding are you basing your hypothesis on? Location of Study Area: Why is this a suitable river to investigate changing channel characteristics downstream? What evidence is there from the map? Assess the extent to which this map is ‘fit for purpose.’ Risk assessment You need to be able to carry out a risk assessment for any research you undertake – outline the risks of carrying out research and suggest strategies for minimising risk. Temburong - River Hazard/Risk Initial level of risk (L/M/H) Control measures (strategy for reducing level of risk) Residual level of risk (L/M/H) 2) Data Collection - Methods There are two types of data: a) Quantitative data – information can be expressed in numerical terms. Research involves using statistics to analyse data (e.g. river width). b) Qualitative data – difficult to measure, count or express in numerical terms (e.g. nature of relationships among groups in society, impacts of tourism in a named area). Researchers also often talk about data being subjective or objective. Subjective – influenced by personal opinion. Objective – undistorted by personal bias. You should also know the difference between primary and secondary data: a) Primary data: Data that is collected and processed by individuals (e.g. questionnaires, raw census data, maps with annotations). b) Secondary data: Data that is collected and processed by other people other than the researcher in question (e.g. processed census data). Once you have decided what type of data you need to collect, you need to decide on a sampling strategy to use to ensure that your results are as accurate and reliable as possible. Why do we need to take a sample when carrying out research? Sampling: Samples are ideally collected to be representative, but in practice they are often selected as a matter of convenience. a) Random sampling: Every value, or member of the “population,” has an equal chance of being selected and the selection of one member does not affect the probability of selection of another member. Random sample is obtained using random numbers, usually generated on a computer. Advantage There is no bias in this sampling method. Disadvantage This is a time-consuming method and be beware that a random sample may miss an entire part of the survey area. b) Systematic sampling: Values are selected in a regular way (systematically). E.g. Choosing every tenth person on a list or every 20th house in a street. Advantage This gives an even coverage of the area being investigated. Disadvantage There is some bias in this sampling method (all points do not have an equal chance of selection). c) Stratified sampling: This is based on knowing something in advance about the population or area in question. If it is known that there are important groups in a population, it is possible to make sure that a representative sample of them is included in a survey. E.g. If you are surveying the attitudes of local people to the opening of a supermarket, your sample must reflect the age distribution of local people. Advantage Sample is representative Disadvantage Comment on how you have chosen to sample your data Outline and justify one method of data collection Discuss the strengths and weaknesses of the method of data collection 3 & 4. Data Presentation & Analysis You must present data using appropriate methods – data must be presented visually and must show all information clearly – it must be easy for the reader to pick out trends, patterns, anomalies in the data. Where appropriate, titles, scales and keys should be clearly marked on presentation. Possible methods for presenting data: Sketch maps Proportional symbols Flow lines, desire lines, trip lines Chloropleths Isopleths Dot maps Graphical skills Line graphs Bar graphs Scattergraphs Pie charts Triangular graphs Kite diagrams Radial diagrams Logarithmic graphs Dispersion graphs Histogram Box and whisker plot It may be appropriate to analyse data using statistical skills – some of these will help to support your analysis Measures of central tendency – mean, median, mode Measures of dispersion – range, interquartile range, standard deviation Spearman’s rank correlation coefficient Scatter Graphs & Spearmann’s rank correlation coefficient Correlation is a method whereby a co-efficient is calculated to describe the degree of association between two sets of paired data/values. This co-efficient is then tested to determine the probability that the association might be due to chance. A correlation is concerned with assessing links, association or relationships between two or more phenomena. It looks at the strength of the relationship between two variables or two sets of data. Give examples of variables that you could correlate together:- Degree’s of correlation Which variable to draw on which axis of the scatter graph? Plot the INDEPENDENT variable on the horizontal axis (termed the X axis) and the DEPENDENT variable on the vertical axis (Y axis). One variable usually has an effect on the other and this should enable you to identify the independent and dependent variables. Example:- temperature decreases as you go up the mountain. Height above sea level is the independent variable but the variable that changes is temperature so that is the dependent variable. Is a visual link precise enough? Not really because it is far too subjective. Vague statements like “The scattergraph seems to me to indicate a weak positive correlation…” are too imprecise. Applying the Spearman Rank Statistical Test means you can QUANTIFY the strength of the relationship that your scattergraph reveals. It is more objective and therefore acceptable to science. How to undertake a Spearman Rank Correlation Statistical Test – a worked example! In this worked example, the two variables we wish to examine are slope angle and soil depth. Our classroom studies have led us to believe that gravity will remove soil from steeper slopes and it will collect at the base of the slope where depths are likely to be higher 1. Formulate the null hypothesis ‘That there is no relationship between soil depth and slope angle’ 2. Examine your data and decide if you think that when slope angles are low then soil depth seems to be high. Are the shallowest soils on the steepest parts of the slope? Location of sample sites Slope angle (in degrees) Soil depth (in cms) 1 0 103 2 1.5 80 3 2 30 4 5 15 5 10 5 6 8 8 7 6 9 8 4 14 9 2.5 25 10 1 50 3. As slope angle increases, soil depth decreases. Therefore this is a negative correlation because if one variable is high the other is low and vice versa. 4. Now rank the first set of data - Highest to lowest i.e. 10 degrees gets given the rank of one, 8 degrees gets the rank of two etc Slope Rank 1 0 10 2 1.5 8 3 2 7 4 5 4 5 10 1 6 8 2 7 6 3 8 4 5 9 2.5 6 10 1 9 5. Now rank the second set of data. Highest to lowest, same as before. (One could rank lowest to highest as long as it is the same for both sets of data). BEWARE:- In this particular example there are no numbers the same in the soil column nor the slope one but if you see this then be alert as awarding the rank needs careful handling! Made-up example of what to do about tied ranks The first 27.5 in the list has absolutely no “right” to be assigned rank 2 whereas the second 27.5 only gets rank 3. They occupy ranks 2 and 3 so add up and divide by 2 = 2.5 each. 29.4 1 27.5 2.5 23.0 5 27.5 2.5 23.8 4 6. Having already ranked slope angle, you now need to rank soil depth Soil depth (in cms) Rank 103 1 80 2 30 4 15 6 5 10 8 9 9 8 14 7 25 5 50 3 7. Your table should now look like this Slope Rank Soil Rank 1 0 10 103 1 2 1.5 8 80 2 3 2 7 30 4 4 5 4 15 6 5 10 1 5 10 6 8 2 8 9 7 6 3 9 8 8 4 5 14 7 9 2.5 6 25 5 10 1 9 50 3 8. Next step…Calculate the difference between the ranks. Take no notice of the sign as the next step is to square the difference in the final column Slope Rank Soil depth Rank d d² 0 10 103 1 9 81 1.5 8 80 2 6 36 2 7 30 4 3 9 5 4 15 6 2 4 10 1 5 10 9 81 8 2 8 9 7 49 6 3 9 8 5 25 4 5 14 7 2 4 2.5 6 25 5 1 1 1 9 50 3 6 36 d = difference between ranks d² = difference squared 9. Now add up all the figures in the d². This gives you the sum of d² or SIGMA squared expressed as:- In this example sum of d² = 326 10. Apply the Spearman Rank formula 11. Rs = 1 - (6 x 326) (10³ - 10) = 1 – 1956 990 = 1 – 1.9758 Rs = - 0.9758 BUT WHAT DOES IT MEAN? We were expecting a negative correlation so our negative number is reassuring! How sure can you be that the results you collected on the day that you went out could not have occurred by chance? Might it all have been “just one of those things”….“a fluke” ….. “a chance occurrence”? The nearer the Rs answer is to plus 1.0 or minus 1.0 the stronger is the degree of correlation. Our answer of -0.98 indicates a very strong negative correlation. We need to state how significant this result is by using a critical values table or graph. 12. Degrees of freedom (df) This is n-2 so in our example it is 10-2 = 8. Consult a graph or a table to find out the critical value.Our answer of minus 0.97 is only significant if the critical value is lower than this. 8 0.549 0.632 0.716 0.765 99% Confidence Because our Rs answer of – 0.97 is bigger than the critical value of 0.765, we can be very confident that chance did not play a part in these results. There really is a significant relationship between slope angle and soil depth. We can have great confidence in our results because on only one occasion in a 100 could the outcome have been due to chance factors. Reject the null hypothesis We can reject the null hypothesis with 99% confidence and accept the alternative hypothesis which is that:“there is a significant negative relationship between slope angle and soil depth. As slope angle increases, soil depth decreases” Geographers can only accept greater than 95% confidence (99% for physical Geography) Now it’s your turn! Sketch of your Scatter Graph Spearmann’s Rank correlation coefficient Describe one technique you used to present data in this enquiry and outline the advantages and disadvantages of it Outline and justify the use of one or more techniques used to statistically analyse your results 5) Drawing conclusions and evaluation Summarise the results to answer the original question/hypothesis Support the summary with reference to evidence from earlier sections Explain results in the light of theories/concepts and location Identify limitations of methods and impacts on results - suggest improvements/extension Explain possible effect of limitations on results Examiner should be able to read conclusion and know what your study was about and what you found out Geographical Information Systems What is this? – the most powerful set of tools in existence for the analysis and visualisation of spatial information. You must be able to use GIS in your investigation. How might you go about using GIS in your investigation? Summarise your findings and suggest how this enquiry could be improved Comment on the strengths and weaknesses of different aspects of the study and suggest improvements In what ways would your conclusions be of use to other people? Possible question alternatives. Starting point 1 2 3 4 5 6 7 8 Methods Skills Interpretation Conclusions/Evaluation What are the advantages and disadvantages of the analysis technique(s) that you used? Outline and justify the use of one or more techniques used to statistically analyse your results Name one technique of data analysis and describe how it was used How far did your fieldwork conclusions match the geographical theory, concept or idea on which your study was based Outline the aim and describe the theory, idea or concept from which your aim was derived Explain the geographical concept, process or theory that underpinned your enquiry Outline and justify one method of data collection that you used Describe one method used to present your data Examine the limitations of your chosen methodology Describe one application of ICT skills in carrying out your fieldwork and comment on its usefulness Outline one source of information that you used and assess the extent to which it was “fit for purpose” Explain how you devised your aim and how you responded to the risks associated with your chosen site for fieldwork Describe the location of your fieldwork and explain why it was suitable for your investigation Describe the purpose of your fieldwork enquiry Outline one hypothesis and describe one methodology for primary data collection in relation to this Describe and illustrate one technique you used to present data in this enquiry How did you respond to risks associated with undertaking primary data collection What difficulties did you face when presenting your results? What is meant by the term ‘significance’ in the analysis of fieldwork data? In what ways would your conclusions be of use to other people? Discuss the strengths and weaknesses of the method of data collection Describe a method of presentation that you used in your investigation and indicate how the chosen method was useful Outline one technique that you have used to present results from your data collection In the context of the analysis of fieldwork data, outline the meaning of ‘anomalies’. Drawing upon your findings, explain how your enquiry improved your understanding of the topic area Describe one method you used to present data collected in your fieldwork investigation Comment on the strengths and weaknesses of different aspects of the study and suggest improvements With the aid of a diagram, describe one technique that you used to present data in your enquiry Explain how the use of ICT can improve geographical understanding Summarise the main findings of your investigation With reference to fieldwork investigations distinguish between qualitative and quantitative data Describe the characteristic features of your study area Comment on the strengths and weaknesses of different aspects of the study. Suggest improvements. In the box provided, draw and annotated sketch map of the location of the study area to show the basic characteristics Summarise your findings and suggest how this enquiry could be improved Making specific reference to your results, suggest how your enquiry could be improved

