Waiting Line Models: Waiting line systems, also called queuing
advertisement
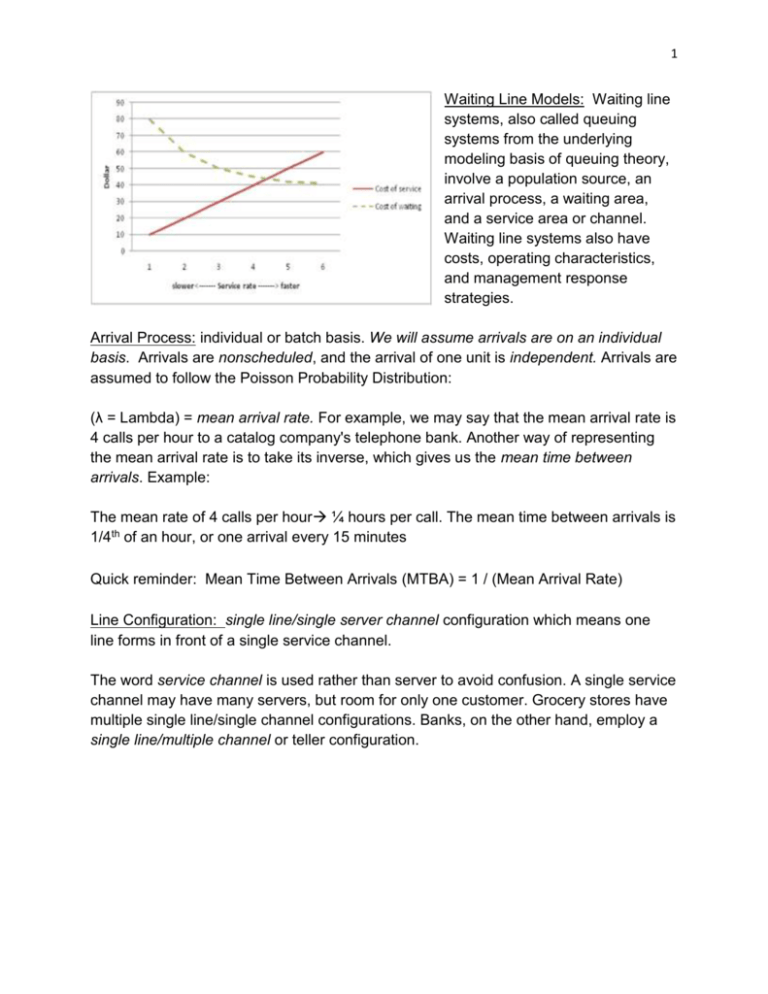
1 Waiting Line Models: Waiting line systems, also called queuing systems from the underlying modeling basis of queuing theory, involve a population source, an arrival process, a waiting area, and a service area or channel. Waiting line systems also have costs, operating characteristics, and management response strategies. Arrival Process: individual or batch basis. We will assume arrivals are on an individual basis. Arrivals are nonscheduled, and the arrival of one unit is independent. Arrivals are assumed to follow the Poisson Probability Distribution: (λ = Lambda) = mean arrival rate. For example, we may say that the mean arrival rate is 4 calls per hour to a catalog company's telephone bank. Another way of representing the mean arrival rate is to take its inverse, which gives us the mean time between arrivals. Example: The mean rate of 4 calls per hour ¼ hours per call. The mean time between arrivals is 1/4th of an hour, or one arrival every 15 minutes Quick reminder: Mean Time Between Arrivals (MTBA) = 1 / (Mean Arrival Rate) Line Configuration: single line/single server channel configuration which means one line forms in front of a single service channel. The word service channel is used rather than server to avoid confusion. A single service channel may have many servers, but room for only one customer. Grocery stores have multiple single line/single channel configurations. Banks, on the other hand, employ a single line/multiple channel or teller configuration. 2 Typical single line/ single service channel configuration Discipline in the waiting line configuration may vary from patient, to balk (view the line, then leave), renege (join the line, then leave), jockey (join the line, then move to another line when you think it is moving faster. Service Channel: The main feature of a service channel in a waiting line system is the service time, also assumed to follow the Exponential Distribution when the time to perform service for one customer is independent from the time to perform service for others. If the average time to serve one customer is 10 minutes, then the mean service rate in hours may be found by converting 10 minutes to hours (10/60 th of an hour), then taking the inverse: Mean Service Rate = 60/10 = 6 customers per hour Operational characteristics of waiting lines: 1.the probability that no customers (or units) are in the system, 2. the average number of customers in the lines, 3. the average number of customers in the system (customers in line plus those being served, 4. the average time a customer spends in the waiting line, 5. the average time a customer spends in the system (waiting time plus time in the service facility, 6. the probability that an arriving customer has to wait for service, 7. the probability of n customers in the system, where n could be any real integer such as 1,2,3.. customers. 3 Economic Analysis of line systems: The total cost of this waiting line system is the sum of the cost of waiting and cost of service. Total Cost = Cost of Waiting + Cost of Service = ( cw L ) + (cs k ) where L=The average number of units in the system k =number of channels cw = cost of waiting cs = cost of service Let’s practice: A call center operation has only one service channel (a customer service representative - CSR) to address questions regarding customers’ online shopping experience (most likely complaints??!!) and/or give additional information about the products customers purchased on line. Customer calls arrive at the call center at a rate of 5 calls per hour. If the CSR is busy the customer is placed in a queue (with music in the background) until the operator is available. It takes the CSR on the average 7.5 minutes to address a customer call. Compute and analyze this line configuration. Notation: ʎ=lambda, the mean arrival rate µ=mu, the mean service rate arrival rate (λ): 5 calls/hour service rate(µ) 7.5 min / call = 1 call/7.5min *60 min µ= 8 calls/hr 1. The probability of an idle system (no customers in the system, P0): P0 = 1 - (lambda/mu) = 1 - (5/8) = 0.375 2. The average number of documents in the waiting line (Lq): Lq = lambda2/ [mu(mu - lambda) ] = 25 / [8 (8-5)] = 1.0417 customers 3. The average number of units in the system (L): L = Lq + (lambda / mu) = 1.0417 + (5/8) = 1.6667 customers From the formula, you can see that this includes the customers in line as well as in the service channel. 4. The average time a customer spends in the waiting line: 4 Wq = Lq / lambda = 1.0417 / 5 = 0.2083 hrs or 12.5 min Note: The initial time units of this and other time-related operating characteristics are the same as the input units. If input arrival and service times and rates are in hours, then output times will be in hours. I converted 0.2083 hours to minutes for ease in interpretation. 5. The average time a customer spends in the system: W = Wq + (1/mu) = 0.2083 + (1/8) = 0.3333 hrs = 20 min As with the number of units in the system parameter, this time includes the time a customer spends in the line, plus the time in service. 6. The probability that an arriving customer has to wait for service: Pw = lambda / mu = 5/8 = 0.625 This operating characteristic is also known as the utilization factor for the service channel. A critical requirement for single line/single channel service systems is that the utilization factor be less than one. Otherwise, the waiting line would explode. In fact, queuing systems are not very efficient anytime the utilization factor exceeds 75 or 80% due to the interaction of the two probability functions. We will illustrate this later. 7. The probability of n customers in the system. Let's say we are interested in knowing the probability of n = 3 customers/callers in the system: Pn = ( lambda/mu)n * P0 = (5/8)3 * 0.375= 0.0916 Since we are working with discrete probabilities, to find the probability of three or less customers in the system: Pn < 3 = P0 + P1 + P2 + P3 = 0.375 + (5/8)1* 0.375 + (5/8)2 * 0.375 + 0.1024 = 0.375 + 0.2344 + 0.1465 + 0.1024 = 0.8583 …and we follow the law of probability that says all probabilities of the distribution must sum to one, so the probability that there will be more than 3 documents in the system is: Pn > 3 = 1 - 0. 8583= 0.1417 5 Costs of the Waiting Line System: The total cost of this waiting line system is the sum of the cost of waiting and cost of service….. Total Cost = Cost of Waiting + Cost of Service = ( cw L ) + (cs k ) where k =number of channels cw = cost of waiting = $25.00 per hour for 1 customer cs = cost of service = $15.00 per hour for technician Total Cost = ($25 * 1.667) + ($15 * 1) = $56.67 Sensitivity analysis: To buffer against explosion, which occurs when the waiting grows and grows and we never catch up, waiting line systems with purely random arrivals are generally kept to a maximum utilization rate of 75%. Note that the above example illustrated a system with a utilization rate of 62.5%. What if the arrival rate increases to 5.5 documents per hour, which represents a 10 % increase? The new utilization rate is: Pw = lambda / mu = 5.5 / 8 = 0.6875, a 10 % increase as well. The line length now increases to: Lq = lambda2/ [mu(mu - lambda) ] = 30.25 / [8 (8-5.5)] = 1.51 customers, a 50% increase! That's why we don't operate at utilization rates above 75%. I really find this interesting from my operational experience. People who say they are working their people at 100% utilization are not working in random service systems - they can't be or the system would be pure chaos all the time. (f) Service Quality: Pw should be 35% or less, compare this figure with 0.625 (or 62.5%); AND Wq should be 2 min or less (the quality of service specified by management), compare this specification with 12.5 min found above….Ouch!! 6 Let’s use QM for Windows for computations and additional sensitivity analysis. 1) Repeat the example, see the results. 2) Assume the operator has been trained and now can process 10 customers per hour (a 25% increase in performance). Redo the problem and work on (f). Was the training worth or more channels are required to meet service quality requirements? See video instructions at: http://screencast.com/t/WkGxNG7Y7QRn
