Plotting Earthquakes and Volcanoes Activity
advertisement
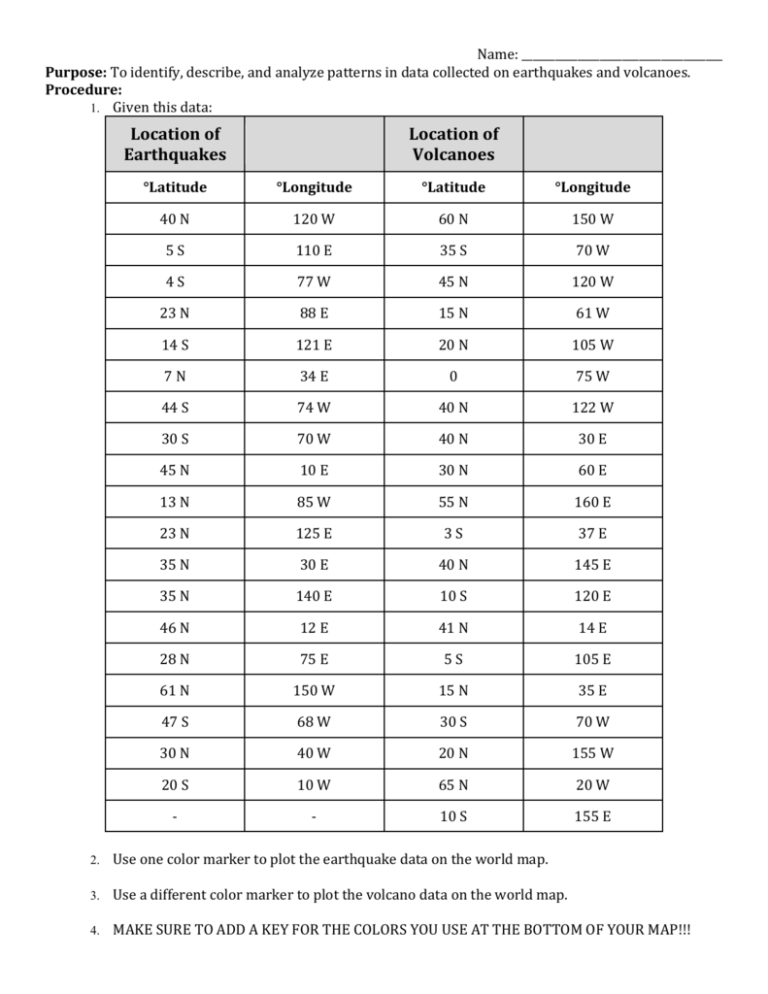
Name: ____________________________________ Purpose: To identify, describe, and analyze patterns in data collected on earthquakes and volcanoes. Procedure: 1. Given this data: Location of Earthquakes Location of Volcanoes °Latitude °Longitude °Latitude °Longitude 40 N 120 W 60 N 150 W 5S 110 E 35 S 70 W 4S 77 W 45 N 120 W 23 N 88 E 15 N 61 W 14 S 121 E 20 N 105 W 7N 34 E 0 75 W 44 S 74 W 40 N 122 W 30 S 70 W 40 N 30 E 45 N 10 E 30 N 60 E 13 N 85 W 55 N 160 E 23 N 125 E 3S 37 E 35 N 30 E 40 N 145 E 35 N 140 E 10 S 120 E 46 N 12 E 41 N 14 E 28 N 75 E 5S 105 E 61 N 150 W 15 N 35 E 47 S 68 W 30 S 70 W 30 N 40 W 20 N 155 W 20 S 10 W 65 N 20 W - - 10 S 155 E 2. Use one color marker to plot the earthquake data on the world map. 3. Use a different color marker to plot the volcano data on the world map. 4. MAKE SURE TO ADD A KEY FOR THE COLORS YOU USE AT THE BOTTOM OF YOUR MAP!!! Name: ____________________________________ Data: Analysis: 1. Observe the pattern of earthquakes and volcanoes over the surface of the Earth. Are they scattered at random or are they concentrated in certain areas and in certain patterns? Describe your observations. 2. Explain our observations – Why do you think that earthquakes and volcanoes occur in these areas? 3. Use a pencil to roughly draw lines where the tectonic plates fit. 4. Observe the pattern of earthquakes and volcanoes in relation to the crustal plates. Are they scattered all over the plates or is there a pattern? Describe your observations. 5. What is the volcano in the middle of that Pacific Ocean? Why is it not on a plate boundary? 6. Write a summary describing what you have learned from this activity. Name: ____________________________________
