Midterm 1
advertisement
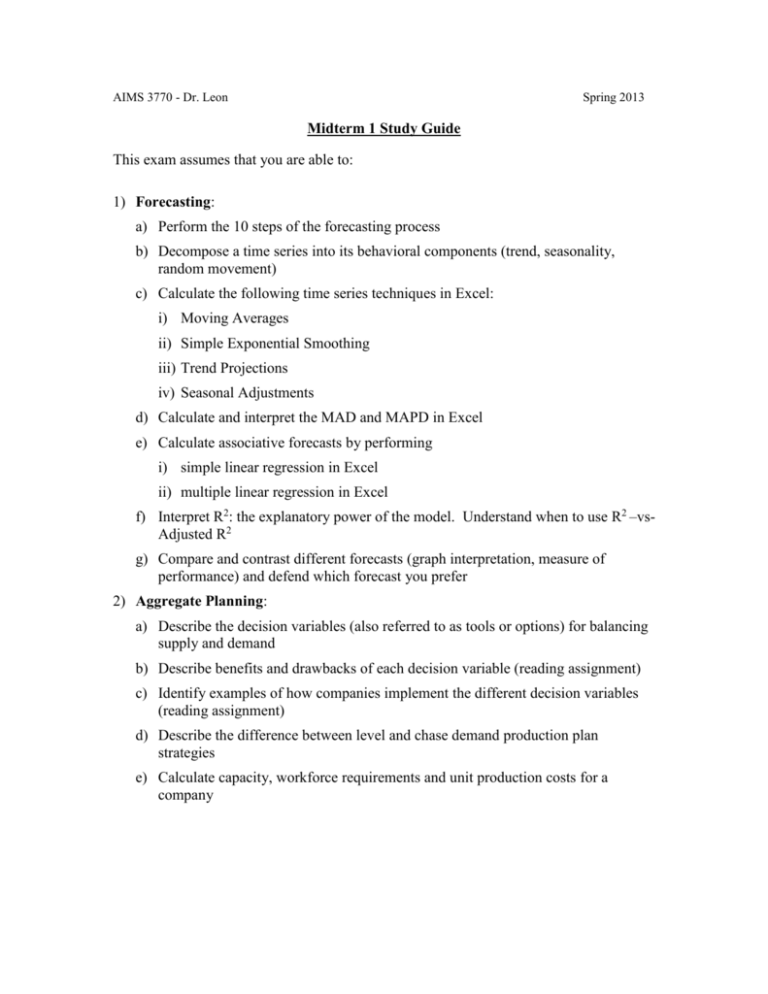
AIMS 3770 - Dr. Leon Spring 2013 Midterm 1 Study Guide This exam assumes that you are able to: 1) Forecasting: a) Perform the 10 steps of the forecasting process b) Decompose a time series into its behavioral components (trend, seasonality, random movement) c) Calculate the following time series techniques in Excel: i) Moving Averages ii) Simple Exponential Smoothing iii) Trend Projections iv) Seasonal Adjustments d) Calculate and interpret the MAD and MAPD in Excel e) Calculate associative forecasts by performing i) simple linear regression in Excel ii) multiple linear regression in Excel f) Interpret R2: the explanatory power of the model. Understand when to use R2 –vsAdjusted R2 g) Compare and contrast different forecasts (graph interpretation, measure of performance) and defend which forecast you prefer 2) Aggregate Planning: a) Describe the decision variables (also referred to as tools or options) for balancing supply and demand b) Describe benefits and drawbacks of each decision variable (reading assignment) c) Identify examples of how companies implement the different decision variables (reading assignment) d) Describe the difference between level and chase demand production plan strategies e) Calculate capacity, workforce requirements and unit production costs for a company EXAM STRUCTURE: The exam will have 3 main sections. Two of the sections will be problems on TimeSeries forecasting and associative forecasting. The last section will be on aggregate planning. The Aggregate Planning question will test your understanding of options available for balancing supply and demand in manufacturing via short answer questions and will refer heavily to reading assignment 1. The Forecasting sections will require you to be able to calculate different forecasting approaches and measures of performances. You will be asked questions regarding a specific set of data and a company. This section will require use of Excel. You will not have to create any graphs but you may have to plot new lines into an existing graph. It will test your understanding of steps in the 10 step forecasting process discussed in class. Formulas for the forecasting portion of the exam will be provided using the notation presented in the powerpoint class slides. This exam is closed book, closed note and closed internet. No calculators, cell phones or other electronics may be used during the exam. Students must use the classroom laptop.
