Engineering Hydrology Tutorial: Statistical Analysis
advertisement
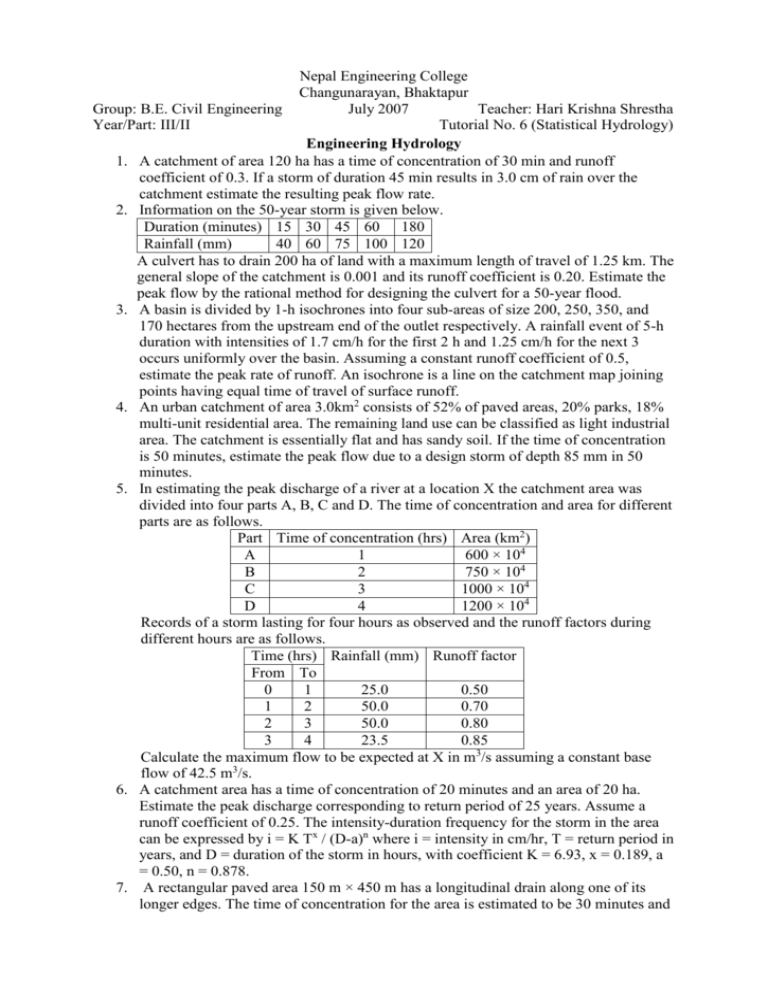
Nepal Engineering College Changunarayan, Bhaktapur Group: B.E. Civil Engineering July 2007 Teacher: Hari Krishna Shrestha Year/Part: III/II Tutorial No. 6 (Statistical Hydrology) Engineering Hydrology 1. A catchment of area 120 ha has a time of concentration of 30 min and runoff coefficient of 0.3. If a storm of duration 45 min results in 3.0 cm of rain over the catchment estimate the resulting peak flow rate. 2. Information on the 50-year storm is given below. Duration (minutes) 15 30 45 60 180 Rainfall (mm) 40 60 75 100 120 A culvert has to drain 200 ha of land with a maximum length of travel of 1.25 km. The general slope of the catchment is 0.001 and its runoff coefficient is 0.20. Estimate the peak flow by the rational method for designing the culvert for a 50-year flood. 3. A basin is divided by 1-h isochrones into four sub-areas of size 200, 250, 350, and 170 hectares from the upstream end of the outlet respectively. A rainfall event of 5-h duration with intensities of 1.7 cm/h for the first 2 h and 1.25 cm/h for the next 3 occurs uniformly over the basin. Assuming a constant runoff coefficient of 0.5, estimate the peak rate of runoff. An isochrone is a line on the catchment map joining points having equal time of travel of surface runoff. 4. An urban catchment of area 3.0km2 consists of 52% of paved areas, 20% parks, 18% multi-unit residential area. The remaining land use can be classified as light industrial area. The catchment is essentially flat and has sandy soil. If the time of concentration is 50 minutes, estimate the peak flow due to a design storm of depth 85 mm in 50 minutes. 5. In estimating the peak discharge of a river at a location X the catchment area was divided into four parts A, B, C and D. The time of concentration and area for different parts are as follows. Part Time of concentration (hrs) Area (km2) A 1 600 × 104 B 2 750 × 104 C 3 1000 × 104 D 4 1200 × 104 Records of a storm lasting for four hours as observed and the runoff factors during different hours are as follows. Time (hrs) Rainfall (mm) Runoff factor From To 0 1 25.0 0.50 1 2 50.0 0.70 2 3 50.0 0.80 3 4 23.5 0.85 Calculate the maximum flow to be expected at X in m3/s assuming a constant base flow of 42.5 m3/s. 6. A catchment area has a time of concentration of 20 minutes and an area of 20 ha. Estimate the peak discharge corresponding to return period of 25 years. Assume a runoff coefficient of 0.25. The intensity-duration frequency for the storm in the area can be expressed by i = K Tx / (D-a)n where i = intensity in cm/hr, T = return period in years, and D = duration of the storm in hours, with coefficient K = 6.93, x = 0.189, a = 0.50, n = 0.878. 7. A rectangular paved area 150 m × 450 m has a longitudinal drain along one of its longer edges. The time of concentration for the area is estimated to be 30 minutes and consists of 25 minutes for over land flow across the pavement to the drain and 5 minutes for the maximum time from the upstream end of the drain to the outlet at the other end. a) Construct the isochrones at 5 minutes interval for this area. b) A rainfall of 7 cm/h occurs on this plot for D minutes and stops abruptly. Assuming a runoff coefficient of 0.8 sketch idealized outflow hydrographs for D = 5 and 40 minutes. 8. A rectangular parking lot is 150 m wide and 300 m long. The time of overland flow across the pavement to the longitudinal gutter along the center is 20 minutes and the estimated total time of concentration to the downstream end of the gutter is 25 minutes. The coefficient of runoff is 0.92. If a rainfall of intensity 6 cm/h falls on the lot for 10 minutes and stops abruptly determine the peak rate of flow. 9. A flood of 4000 m3/s in a certain river has a return period of 40 years. (a) What is its probability of exceedence? (b) What is the probability that a flood of 4000 m3/s or greater magnitude may occur in the next 20 years? (c) What is the probability of occurrence of a flood of magnitude less than 4000 m3/s? 10. Complete the following: a) Probability of a 10-year flood occurring at least once in the next 5 years is ………. b) Probability that a flood of magnitude equal to or greater than the 20-year flood will not occur in the next 20 years is ……………… c) Probability of a flood equal to or greater than a 50-year flood occurring next year is ………………. d) Probability of a flood equal to or greater than 50-year flood occurring three times in the next 10 years is ……………… e) Probability of a flood equal to or greater than a 50-year flood occurring at least once in the next 50 years is ………………… 11. A table showing the variation of the frequency factor K in the Gumbel’s extreme value distribution with the sample size N and return period T is often given in books. The following is an incomplete listing of K for T = 1000 years. Complete the table. Sample size, N Value of K(T,N) for t = 1000 years 25 5.842 30 5.727 35 40 5.576 45 50 5.478 55 60 65 70 5.359 12. The following table gives the observed annual flood values in the River Bhagirathi at Tehri. Estimate the flood peaks with return periods of 50, 100, and 1000 years by using: a) Gumbel’s extreme value distribution b) log-Pearson Type III distribution, and c) log-normal distribution 13. A hydraulic structure on a stream has been designed for a discharge of 350 m3/s. If the available flood data on the stream is for 20 years and the mean and standard deviation for annual series are 121 and 60 m3/s respectively, calculate the return period for the design flood by using Gumbel’s method. 14. The flood data of a river was analysed for the prediction of extreme values by logPearson Type III distribution. Using the variate z = log Q, where Q = flood discharge in the river, it was found that zavg = 2.510, z = 0.162 and coefficient of skew Cs = 0.70. (a) Estimate the flood discharges with return periods of 50, 100, 200 and 1000 years in the river. (b) What would be the corresponding flood discharge if log-normal distribution was used? 15. The frequency analysis of flood data of a river by using log-Pearson Type III distribution yielded the following data: Return Period (T) in years Peak flood (m3/s) 50 10000 200 15000 Given the following data regarding the variation of the frequency factor K with the return period T for Cs = 0.4, estimate the flood magnitude in the river with a return period of 1000 years. Return Period (T) in years 50 200 1000 Frequency Factor (K) 2.261 2.949 3.670 16. A river has 40 years of annual flood flow record. The discharge values are in m3/s. The logarithms of base 10 of these discharge values show a mean value of 3.2736, standard deviation of 0.3037 and a coefficient of skewness of 0.07. Calculate the 50 year return period annual flood discharge by (a) log normal distribution, and (b) logPearson Type III distribution. 17. The following data give flood-data statistics of two rivers in UP. S. River Length of Records Mean annual flood n-1 3 No. (years) (m /s) 1 Ganga at Raiwala 92 6437 2951 2 Yamuna at Tajewala 54 5627 3360 a) Estimate the 100 and 1000 year floods for these two rivers by using Gumbel’s method. b) What are the 95% confidence intervals for the predicted values? 18. For a river, the estimated flood peaks for two return periods by the use of Gumbel’s method are as follows. Return Period (T) in years Peak flood (m3/s) 100 435 50 395 What flood discharge in this river will have a return period of 1000 years? 19. Using 30 years data and Gumbel’s method the flood magnitudes, for return periods of 100 and 50 years for a river are found to be 1200 and 1060 m3/s respectively. a) Determine the mean and standard deviation of the data used and b) Estimate the magnitude of a flood with a return period of 500 years. 20. The ordinates of a mass curve of rainfall from a severe storm in a catchment are given. Ordinates of a 12-h unit hydrograph applicable to the catchment are also given. Using the given mass curve, develop a design storm to estimate the design flood for the catchment. Taking the index as 0.15 cm/h, estimate the resulting flood hydrograph. Assume the base flow to be 50 m3/s. Time (h) 0 12 24 36 48 60 72 84 96 108 120 132 Cumulative rainfall 0 10.2 30.5 34 36 (cm) 12-h UH ordinate (m3/s) 0 32 96 130 126 98 75 50 30 15 7 0 21. A 6-hr unit hydrograph is in the form of a triangle with a peak of 50 m3/s at 24 hours from start. The base is 54 hours. The ordinates of a mass curve of rainfall from a severe storm in the catchment is as below: Time (h) 0 6 12 18 24 Cumulative rainfall (cm) 0 5 12 15 17.6 Using this data, develop a design storm and estimate the design flood for the catchment. Assume index = 0.10 cm/h and the base flow = 20 m3/s. 22. A water resources project has an expected life of 20 years. (a) For an acceptable risk of 5% against the design flood, what design return period is to be adopted? (b) If the above return period is adopted and the life of the structure can be enhanced to 50 years, what is the new risk value? 23. A factory is proposed to be located on the edge of the 50 year flood plain of a river. If the design life of the factory is 25 years, what is the reliability that it will not be flooded during its design life? 24. A spillway has a design life of 20 years. Estimate the required return period of a flood if the acceptable risk of failure of the spillway is 10% (a) in any year and (b) over its design life. 25. Show that if the life of a project n has a very large value, the risk of failure is 0.632 when the design period is equal to the life of the project, n. Hint: Show that (1 – (1/n)n = e-1 for large values of n. 26. Analysis of the annual flood peak data of river Damodar at Rhondia, covering a period of 21 years yielded a mean of 8520 m3/s and a standard deviation of 3900 m3/s. A proposed water control project on this river near this location is to have an expected life of 40 years. Policy decision of the project allows an acceptable reliability of 85%. (a) Using Gumbel’s method, recommend the flood discharge for this project. (b) If a safety factor for flood magnitude of 1.3 is desired, what discharge is to be adopted? What would be the corresponding safety margin? Source of the tutorial problems 1 to 26: Subramanya, K. , 1994, Engineering Hydrology, 2nd Edition, Tata McGraw-Hill Publishing Company Limited, New Delhi, ISBN 0-07-462449-8

