Word - IUPAC Task Group on Atmospheric Chemical Kinetic Data
advertisement

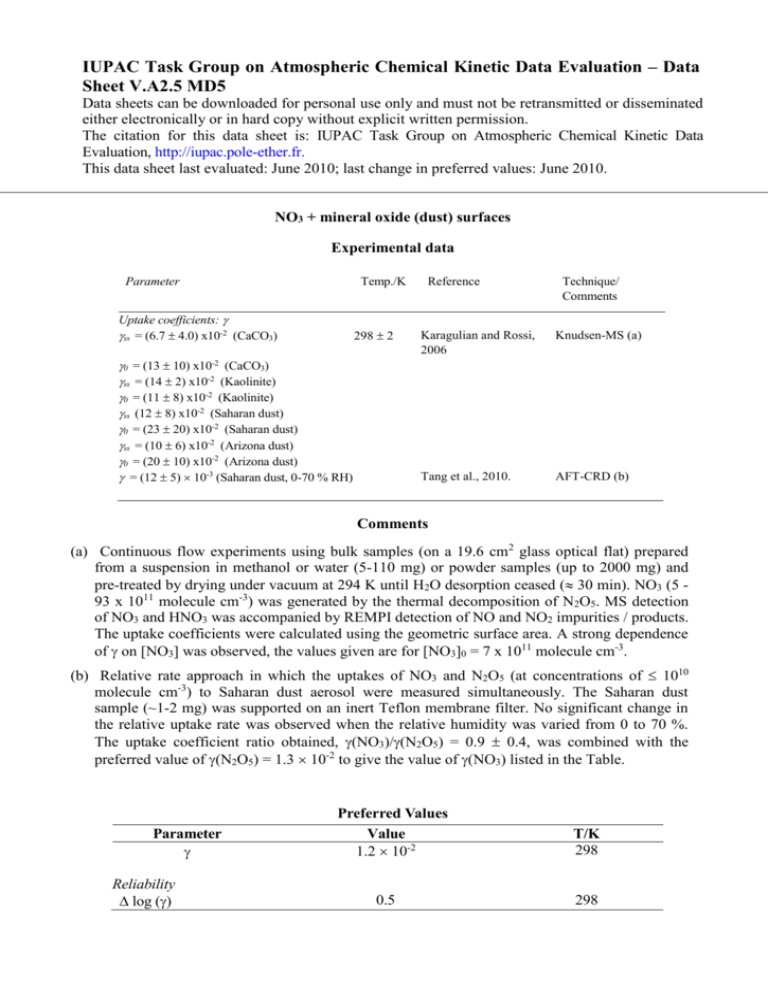
IUPAC Task Group on Atmospheric Chemical Kinetic Data Evaluation – Data Sheet V.A2.5 MD5 Data sheets can be downloaded for personal use only and must not be retransmitted or disseminated either electronically or in hard copy without explicit written permission. The citation for this data sheet is: IUPAC Task Group on Atmospheric Chemical Kinetic Data Evaluation, http://iupac.pole-ether.fr. This data sheet last evaluated: June 2010; last change in preferred values: June 2010. NO3 + mineral oxide (dust) surfaces Experimental data Parameter Temp./K Uptake coefficients: ss = (6.7 4.0) x10-2 (CaCO3) 298 2 0 = (13 10) x10-2 (CaCO3) ss = (14 2) x10-2 (Kaolinite) 0 = (11 8) x10-2 (Kaolinite) ss (12 8) x10-2 (Saharan dust) 0 = (23 20) x10-2 (Saharan dust) ss = (10 6) x10-2 (Arizona dust) 0 = (20 10) x10-2 (Arizona dust) = (12 5) 10-3 (Saharan dust, 0-70 % RH) Reference Technique/ Comments Karagulian and Rossi, 2006 Knudsen-MS (a) Tang et al., 2010. AFT-CRD (b) Comments (a) Continuous flow experiments using bulk samples (on a 19.6 cm2 glass optical flat) prepared from a suspension in methanol or water (5-110 mg) or powder samples (up to 2000 mg) and pre-treated by drying under vacuum at 294 K until H2O desorption ceased ( 30 min). NO3 (5 93 x 1011 molecule cm-3) was generated by the thermal decomposition of N2O5. MS detection of NO3 and HNO3 was accompanied by REMPI detection of NO and NO2 impurities / products. The uptake coefficients were calculated using the geometric surface area. A strong dependence of on [NO3] was observed, the values given are for [NO3]0 = 7 x 10¹¹ molecule cm-3. (b) Relative rate approach in which the uptakes of NO3 and N2O5 (at concentrations of 1010 molecule cm-3) to Saharan dust aerosol were measured simultaneously. The Saharan dust sample (~1-2 mg) was supported on an inert Teflon membrane filter. No significant change in the relative uptake rate was observed when the relative humidity was varied from 0 to 70 %. The uptake coefficient ratio obtained, (NO3)/(N2O5) = 0.9 0.4, was combined with the preferred value of (N2O5) = 1.3 10-2 to give the value of (NO3) listed in the Table. Parameter Reliability log () Preferred Values Value 1.2 10-2 0.5 T/K 298 298 Comments on Preferred Values Karagulian and Rossi (2005) found efficient and irreversible uptake of NO3 to various mineral dust substrates. A strong dependence of on [NO3] may imply that interaction of [NO3] with the dust samples uptake is not simply defined by . With the exception of kaolinite, the ratio of 0 / ss was found to be a factor of two. As the uptake coefficients were based on the projected, geometric surface area of the dust sample, they represent upper limits. Tang et al. (2010), used a relative rate approach, which allowed them to derive uptake coefficients relative to N2O5 on the same substrate. This eliminated the need for absolute surface area estimation. As Tang et al. used the same dust as in their absolute AFT experiments (Wagner et al, 2008) the relative rate measurement can be reliably converted to an absolute one. The much smaller uptake coefficient for NO3 + Saharan dust determined by Tang et al. compared to Karagulian et al. (despite use of the same dust sample) most probably reflects use of the geometric surface area to derive in the Knudsen reactor experiments. As Tang et al point out, the two absolute studies of Karagulian et al (2005, 2006) on N2O5 and NO3 uptake to Saharan dust also result on an uptake coefficient ratio close to unity, supporting the dataset of Tang et al., which provides the basis of our recommendation. References Karagulian, F., and Rossi, M. J.: Phys. Chem. Chem. Phys. 7, 3150-3162, 2005. Karagulian, F., Santschi, C., and Rossi, M. J.: Atmos. Chem. Phys. 6, 1373-1388, 2006. Tang, M. J., Thieser, J., Schuster, G. and Crowley, J. N.: Atmos. Chem. Phys. 10, 2965-2974, 2010. Wagner, C., Hanisch, F., de Coninck, H. C., Holmes, N. S., Schuster, G. and Crowley, J. N.: Atmos. Chem. Phys. 8, 91-109, 2008.


