Fossil Record - The Biology Corner
advertisement
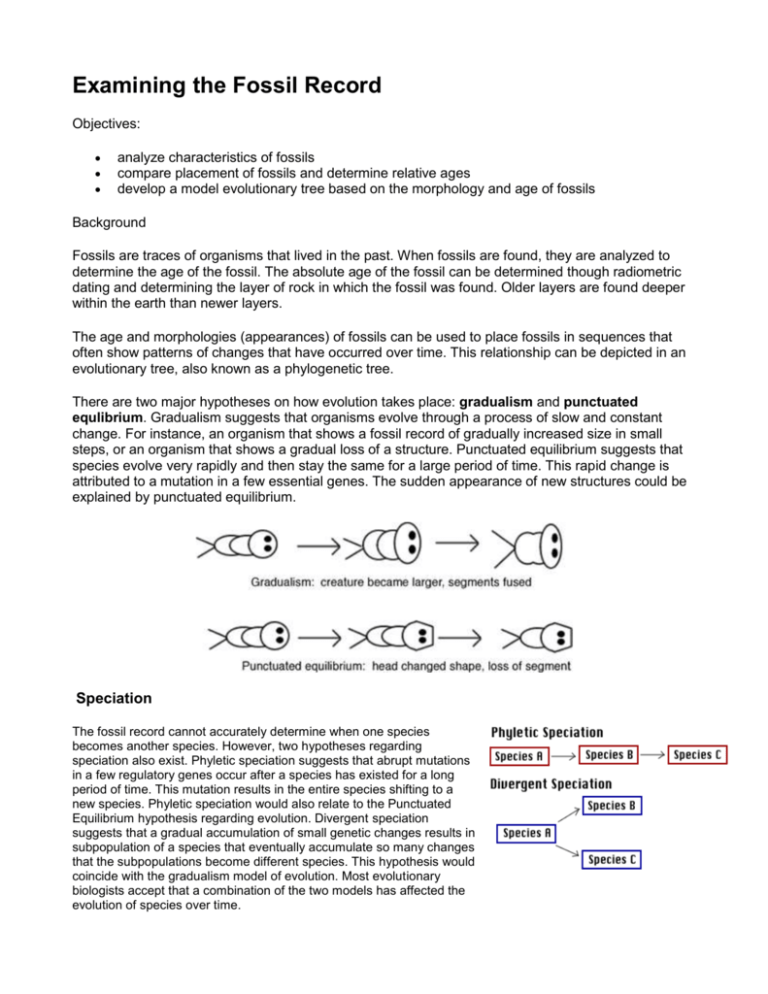
Examining the Fossil Record Objectives: analyze characteristics of fossils compare placement of fossils and determine relative ages develop a model evolutionary tree based on the morphology and age of fossils Background Fossils are traces of organisms that lived in the past. When fossils are found, they are analyzed to determine the age of the fossil. The absolute age of the fossil can be determined though radiometric dating and determining the layer of rock in which the fossil was found. Older layers are found deeper within the earth than newer layers. The age and morphologies (appearances) of fossils can be used to place fossils in sequences that often show patterns of changes that have occurred over time. This relationship can be depicted in an evolutionary tree, also known as a phylogenetic tree. There are two major hypotheses on how evolution takes place: gradualism and punctuated equlibrium. Gradualism suggests that organisms evolve through a process of slow and constant change. For instance, an organism that shows a fossil record of gradually increased size in small steps, or an organism that shows a gradual loss of a structure. Punctuated equilibrium suggests that species evolve very rapidly and then stay the same for a large period of time. This rapid change is attributed to a mutation in a few essential genes. The sudden appearance of new structures could be explained by punctuated equilibrium. Speciation The fossil record cannot accurately determine when one species becomes another species. However, two hypotheses regarding speciation also exist. Phyletic speciation suggests that abrupt mutations in a few regulatory genes occur after a species has existed for a long period of time. This mutation results in the entire species shifting to a new species. Phyletic speciation would also relate to the Punctuated Equilibrium hypothesis regarding evolution. Divergent speciation suggests that a gradual accumulation of small genetic changes results in subpopulation of a species that eventually accumulate so many changes that the subpopulations become different species. This hypothesis would coincide with the gradualism model of evolution. Most evolutionary biologists accept that a combination of the two models has affected the evolution of species over time. Procedure: 1. The diagram you are creating requires a large space. To create your workspace, tape together 8 sheets of standard sized paper. Use a ruler to draw the following chart on your workspace Time Period Began (years ago) Fossils ( 2 1/2 inches wide) ( 2 1/2 inches wide) (8 inches wide) Wyomington (oldest) 995,000 Ohioian 745, 000 Nevadian 545,000 Texian 445,000 Oregonian 395,000 Coloradian 320,000 Montanian 170,000 Californian 80,000 Idahoan (the present) 30,000 (Each row here must be 4 inches tall) 2. The group of "fossils" you will work with are fictitious animals. Each fossil on your sheet is marked with a time period. Cut out each fossil and make sure you include the time period marked below it. 3. Arrange the fossils by age. On your data chart, place each fossil next to the period from which the fossil came from. The term "upper" means more recent and should be placed lower in the row. The term "lower" means an earlier time period, fossils from a "lower" time period should be place toward the older time periods. In each fossil column, you may have 3 specimens, one from the main time period, one from the upper and one from the lower. Not all fossils are represented, illustrating the incompleteness of any fossil record. 4. While keeping the fossils in the proper age order, arrange them by morphology (appearance). To help you understand the morphology of the specimen, view the diagram. Arrange the fossils using the following steps. a. Center the oldest fossil at the top of the fossil column (toward the oldest layer) b. Through the chart, those fossils that appear to be the same (or close to the same) as the fossils preceding them should be placed in a vertical line c. During a certain period, the fossils will split into two branches. In other words, one fossil from that period will show one type of change, and another fossil will show a different change. When this happens, place the fossils side by side in the appropriate time period. From this point on you will have two lineages? 5. Once all the fossils have been placed correctly according to time and morphology, tape or glue the fossils in place. Analysis 1. Give a brief description of the evolutionary changes that occurred in the organism. 2. During which time period did the fossils differentiate into two branches? 3. Explain how the chart illustrates both punctuated equilibrium and gradualism. Use specific fossils from the chart to support your answer. 4. Making the assumption that each fossil represents a separate species. Explain how the chart illustrates divergent and phyletic speciation. Use specific fossils from the chart to support your answer. 5. Define the following terms: morphology fossil phylogenetic tree 6. Examine the fossil that was unearthed in a museum, apparently the labels and other information were lost. Using your fossil record, determine the time period this fossil is likely from. Explain your reasoning. 7. Of the two major species that arose from the parent species, which was more successful? How do you know? 8. For each of the “blanks” on your fossil record, draw in what the organism appearance is likely to be. Draw this directly on your fossil record. Fossils
