thermal stability of diamond like carbon thin films prepared us
advertisement

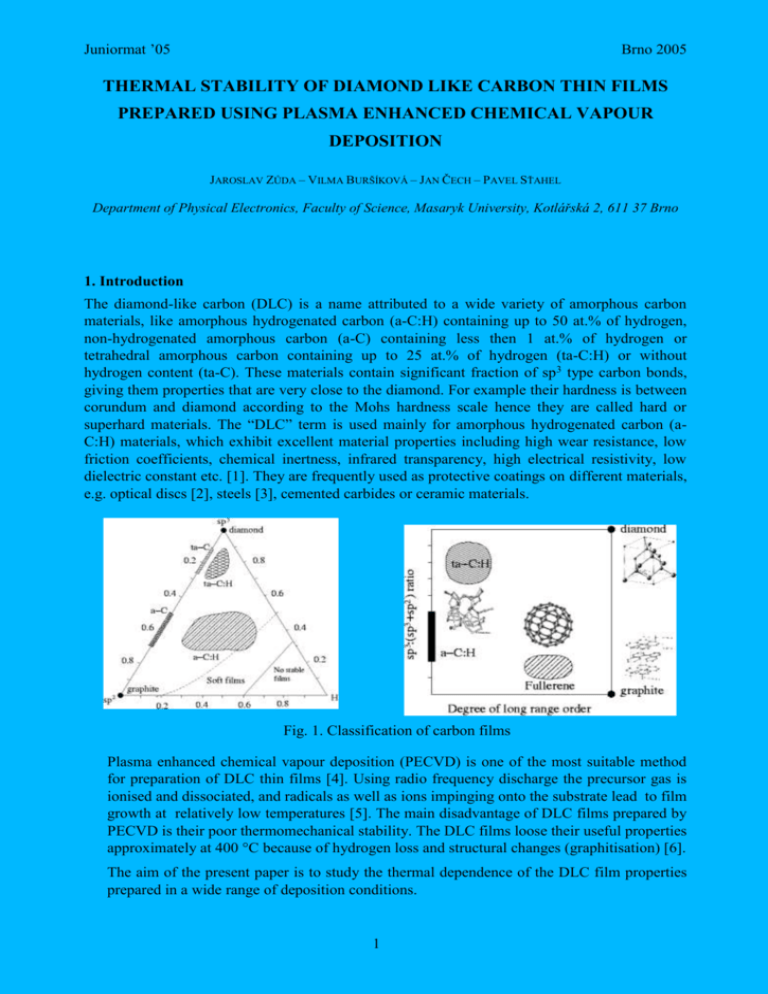
Juniormat ’05 Brno 2005 THERMAL STABILITY OF DIAMOND LIKE CARBON THIN FILMS PREPARED USING PLASMA ENHANCED CHEMICAL VAPOUR DEPOSITION JAROSLAV ZŮDA – VILMA BURŠÍKOVÁ – JAN ČECH – PAVEL SŤAHEL Department of Physical Electronics, Faculty of Science, Masaryk University, Kotlářská 2, 611 37 Brno 1. Introduction The diamond-like carbon (DLC) is a name attributed to a wide variety of amorphous carbon materials, like amorphous hydrogenated carbon (a-C:H) containing up to 50 at.% of hydrogen, non-hydrogenated amorphous carbon (a-C) containing less then 1 at.% of hydrogen or tetrahedral amorphous carbon containing up to 25 at.% of hydrogen (ta-C:H) or without hydrogen content (ta-C). These materials contain significant fraction of sp3 type carbon bonds, giving them properties that are very close to the diamond. For example their hardness is between corundum and diamond according to the Mohs hardness scale hence they are called hard or superhard materials. The “DLC” term is used mainly for amorphous hydrogenated carbon (aC:H) materials, which exhibit excellent material properties including high wear resistance, low friction coefficients, chemical inertness, infrared transparency, high electrical resistivity, low dielectric constant etc. [1]. They are frequently used as protective coatings on different materials, e.g. optical discs [2], steels [3], cemented carbides or ceramic materials. Fig. 1. Classification of carbon films Plasma enhanced chemical vapour deposition (PECVD) is one of the most suitable method for preparation of DLC thin films [4]. Using radio frequency discharge the precursor gas is ionised and dissociated, and radicals as well as ions impinging onto the substrate lead to film growth at relatively low temperatures [5]. The main disadvantage of DLC films prepared by PECVD is their poor thermomechanical stability. The DLC films loose their useful properties approximately at 400 °C because of hydrogen loss and structural changes (graphitisation) [6]. The aim of the present paper is to study the thermal dependence of the DLC film properties prepared in a wide range of deposition conditions. 1 Juniormat ’05 Brno 2005 2. EXPERIMENTAL We used a capacitively coupled radio frequency PECVD reactor for deposition of thin films. The vacuum system consisted of a rotary pump. Minimum pressure achieved was 1,5 Pa. The reactor shell was made of glass, the bases were made of stainless steel. The electrodes were made of graphite discs. The lower electrode was capacitively coupled to the Cesar 136 RF generator working at frequency of 13,56 MHz. The supplied power was 50 W. The negative self-bias voltage varied from -370 V to -265 V. The gas mixture was fed to the reactor by glass torus with many outlets on its perimeter. The flow rate of gases was controlled using Hastings flow controllers. The flow rate of methane was kept at 2,85 sccm (standard cubic centimetre per minute, specified at T=298 K, p=1,01x10⁵ Pa). The flow rate of hydrogen varied from 1 sccm to 7 sccm. The working pressure varied from 16 Pa to 29,7 Pa. The silicon substrates were pretreated for 5 min in hydrogen discharge at a pressure of 6 Pa and flow rate of 1 sccm [7]. The film mechanical properties were measured by depth sensing indentation technique using Fischerscope H100 tester. The method is based on detection of indentation depth for each applied load. It enables separation of plastic and elastic part of deformation so it is more suitable for measurements of thin films [6]. The hardness was measured for loads from 5 mN to 100 mN. The time of loading was 20 s, the holding time was 5 s and the time of unloading was 20 s. This method was used to determinate Vickers hardness and elastic modulus of the films. The optical properties were measured at ellipsometer Jobin Yvou UVISEL in spectral range from 240 to 830 nm. The films on silicon substrates were annealed in the laboratory furnace Classic Clare 4.0. The furnace chamber was evacuated by turbomolecular pump down to minimum pressure of about 10-5 Pa. The studied samples were subjected to heating with constant heating rate of 10K/min. The mass spectrometer Pfeiffer Vacuum Prisma 80 was set in order to follow the evolution in time of 8 specific masses. These specific masses are associated to the ions originated from desorbed gas mixture. 3. RESULTS AND DISCUSSION Fig. 2. shows example of the desorbed flux of the hydrogen molecules obtained during the thermal desorption spectroscopy (TDS). The desorption of hydrogen is minimal until 250 C. Until 350 C it increases slowly. DLC thin films contain a certain amount of non-bonded hydrogen. According to our presumption the first slight increase in hydrogen desorption belongs to the release of non-bonded hydrogen. Interesting is the fact, that the hardness has an increasing tendency in temperature range from 250 to 350 C. It can be interpreted by desorption of free hydrogen in the film. Achieving the temperature of 400 C, the bonded hydrogen starts rapidly to leave the film. The first desorption peak is associated to the loss of hydrocarbon groups, which are decorating some graphite islands existing in the film. The loss of bonded hydrogen results in decrease of sp3-bonded carbon content and in creation and growth of islands with prevalence of sp2-bonded carbon. This process leads in complete graphitisation of the film. This desorption of bonded hydrogen is related to the desorption of hydrocarbon fragments (CH+, CH2+, CH3+, CH4+, etc.). Example of the desorbed flux of CH4+ is shown in Figure 3. The maximum of the desorption peak is at 500 C. The rapid graphitisation is often accompanied with cracking and delamination of the film due to rapid change in the film structure. The next peak at temperature of 720 C is related to the release of remained hydrogen from film and the substrate. 2 Juniormat ’05 Brno 2005 4.0x10 3.0x10 2.0x10 1.0x10 -8 Hydrogen QMS signal [a.u.] QMS signal[a.u.] Thermal stability 5.0x10 -8 -8 -8 -8 2.5x10 -9 2.0x10 -9 1.5x10 -9 1.0x10 -9 m/e =16 5.0x10 -10 0.0 0.0 0 200 400 600 o 800 1 000 0 200 400 600 800 1000 O Temperature [ C] Temperature [ C] Fig. 3. Desorbed flux of CH4+ Fig. 2. Desorbed flux of the hydrogen The following results were obtained on DLC coating prepared from mixture of methane and H 2. The deposition time was 120 min. Fig. 4 shows dependence of applied load on indentation depth. From loading and unloading curves we are able to determine the universal hardness HU, so called plastic hardness, elastic modulus Y = E/(1-2), where E is the Young’s modulus and is the Poisson’s ratio) . The hardness of the silicon substrate was 13 GPa and the hardness of the glass substrate was 7 GPa. At higher loads, there is an evident influence of the substrate hardness on the measured hardness values. At low loads the film on silicon substrate shows very high elastic recovery (see Fig. 4 and Fig. 5). In Tab. 1 the dependence of the hardness and elastic modulus on the annealing temperature is shown. In the temperature range up to 350 C, there is almost no change in mechanical properties. Achieving the temperature of 400 C, rapid decrease in the hardness and elastic modulus begins due to the graphitisation process. Tab. 1 Dependence of the hardness HUpl and elastic modulus Y (E is the Young’s modulus and is the Poisson’s ratio) of DLC coated silicon ssubstrate on the annealing temperature. (The results were obtained at maximum load of 10 mN. The coating thickness was 477nm.) Annealing temperature [oC] HUpl Y=E/(1-2) hmax hr [GPa] [GPa] [nm] [nm] 0 21,70,4 1251 0,249 0,132 250 22,10,5 1251 0,248 0,131 288 22,20,5 1201 0,254 0,130 410 12,00,7 1031 0,282 0,175 3 Juniormat ’05 Brno 2005 5. CONCLUSION We prepared diamond like carbon films on silicon and glass substrate by means of PECVD technique. Some samples were heated and the desorption flux of few components was measured. We interpreted the hydrogen desorption. The hydrogen desorption started approximately at 320 C. The first increase is associated with the desorption of non-bonded hydrogen. The graphitisation process started approximately at 400 C. We used the depth sensing indentation test in order to study the mechanical properties of the as deposited and annealed samples. ACKNOWLEDGEMENT The present work was supported by Scientific foundation of the Czech Republic under projects 202/05/0777 and 106/05/0274. Literature [1] W. Kulisch, Deposition of Diamond-Like Superhard Materials, Springer, Berlin, 1999 [2] F. Piazza, D. Grambole, D. Schneider, C. Casiraghi, A. C. Ferrari, J. Robertson, Diamond Relat. Mater. [3] R. D. Mansano, M. Massi, A. P. Mousinho, L. S. Zambom, L. G. Neto, Diamond Relat. Mater. 12 (2003) 749 [4] J. Robertson, Reports: A Review Journal 37 (2002) 129 [5] http://www.elettra.trieste.it/experiments/beamlines/lilit/htdocs/people/luca/tesihtml/node34.h tml [6] V. Buršíková, V. Navrátil, L. Zajíčková, J. Janča, Mater. Sci. Eng. A324 (2002) 251 [7] D. Franta, V. Buršíková, I. Ohlídal, L. Zajíčková, P. Sťahel, Elsevier Science (submitted fo publication) [8] http://www.wikipedia.org DLC film on glass substrate DLC film on silicon substrate 30 DLC film on glass substrate DLC film on silicon substrate 8 HU pl [GPa] A p p lie d lo a d [m N ] 10 6 4 25 20 15 2 0 10 0,00 0,05 0,10 0,15 0,20 0,25 0 Indentation depth [ m] 200 400 600 800 1000 Applied load [mN] Fig. 5 Dependence of plastic hardness on applied load Fig. 4 Applied load as function of indentation depth 4


