Sim Water
advertisement
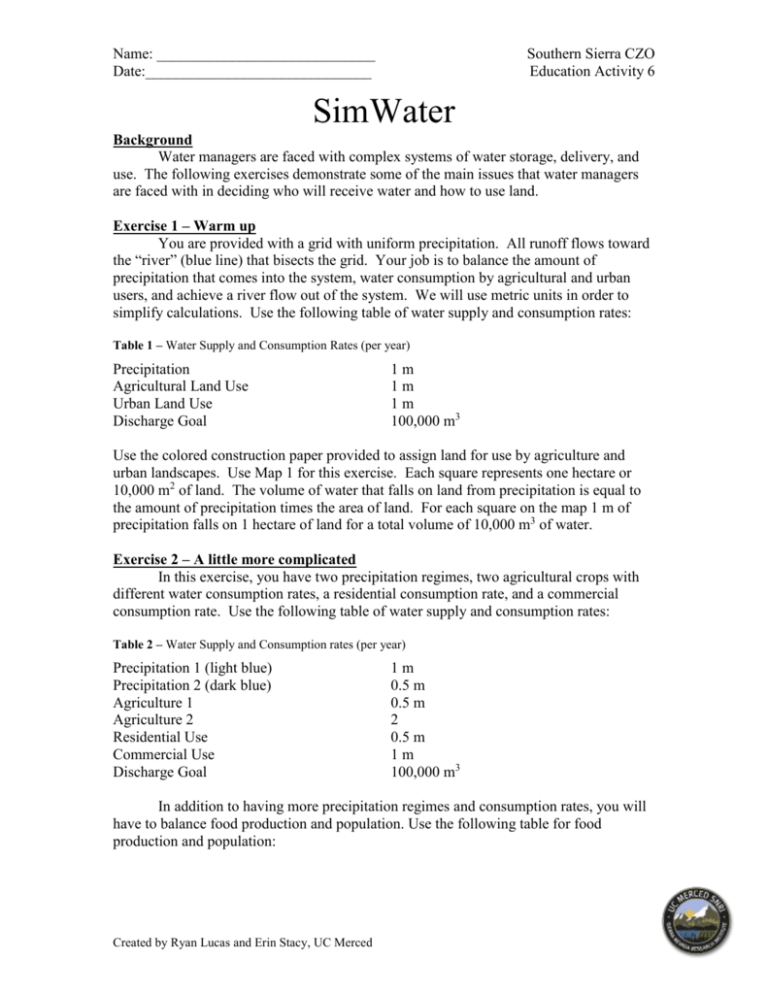
Name: _____________________________ Date:______________________________ Southern Sierra CZO Education Activity 6 SimWater Background Water managers are faced with complex systems of water storage, delivery, and use. The following exercises demonstrate some of the main issues that water managers are faced with in deciding who will receive water and how to use land. Exercise 1 – Warm up You are provided with a grid with uniform precipitation. All runoff flows toward the “river” (blue line) that bisects the grid. Your job is to balance the amount of precipitation that comes into the system, water consumption by agricultural and urban users, and achieve a river flow out of the system. We will use metric units in order to simplify calculations. Use the following table of water supply and consumption rates: Table 1 – Water Supply and Consumption Rates (per year) Precipitation Agricultural Land Use Urban Land Use Discharge Goal 1m 1m 1m 100,000 m3 Use the colored construction paper provided to assign land for use by agriculture and urban landscapes. Use Map 1 for this exercise. Each square represents one hectare or 10,000 m2 of land. The volume of water that falls on land from precipitation is equal to the amount of precipitation times the area of land. For each square on the map 1 m of precipitation falls on 1 hectare of land for a total volume of 10,000 m3 of water. Exercise 2 – A little more complicated In this exercise, you have two precipitation regimes, two agricultural crops with different water consumption rates, a residential consumption rate, and a commercial consumption rate. Use the following table of water supply and consumption rates: Table 2 – Water Supply and Consumption rates (per year) Precipitation 1 (light blue) Precipitation 2 (dark blue) Agriculture 1 Agriculture 2 Residential Use Commercial Use Discharge Goal 1m 0.5 m 0.5 m 2 0.5 m 1m 100,000 m3 In addition to having more precipitation regimes and consumption rates, you will have to balance food production and population. Use the following table for food production and population: Created by Ryan Lucas and Erin Stacy, UC Merced Name: _____________________________ Date:______________________________ Southern Sierra CZO Education Activity 6 Table 3 - Food production and population Agriculture 1 Agriculture 2 Residential Use Commercial Use produces food for 6 people per year produces food for 18 people per year provides home to 80 people provides employment for 100 people Use Map 2 for this exercise. Exercise 3 – A Model California In this exercise we will use Map 3. This map is broken into four precipitation regimes to simulate the Coastal areas (light blue), the Central Valley (orange), the Sierra foothills (dark blue), and the Sierra Nevada mountains (purple). We will use the same two agricultural consumption rates and the same residential and commercial consumption rates. Use the following table for water supply and consumption rates: Table 4 - Water Supply and Consumption rates Precipitation 1 (light blue) Precipitation 2 (orange) Precipitation 3 (dark blue) Precipitation 4 (purple) Agriculture 1 Agriculture 2 Residential Use Commercial Use Discharge Goal 1m 0.25 m 2m 3m 0.5 m 2 0.5 m 1m 100,000 m3 In addition to the food production and population guidelines provided in Exercise 2, we can make this step more challenging by applying some land use rules to Exercise 3: 1. Due to the environmental impact of developing near a river, no residential or commercial land use is allowed within 300 m of the river (each side of a grid box is = 100 m). 2. In order to prevent coastal erosion and fertilizer runoff into the ocean, no residential, industrial, or agricultural land use is allowed within 200 m of the coast. 3. Poor soils and snowy winters prohibit agriculture in the Sierra Nevada mountains (purple region). To meet these rules, you may find it easier to work with a physical printout of your map, where you can cross out sections, before entering numbers into the calculations sheet. Try the exercise as written, and then try the exercise and take some creative liberties. For example, you may want to build some reservoirs and/or irrigation canals or your population may invent some technologies that prevent agricultural runoff into the ocean. Created by Ryan Lucas and Erin Stacy, UC Merced


