Flow Rate & Capacity Analysis: Bottleneck Management
advertisement
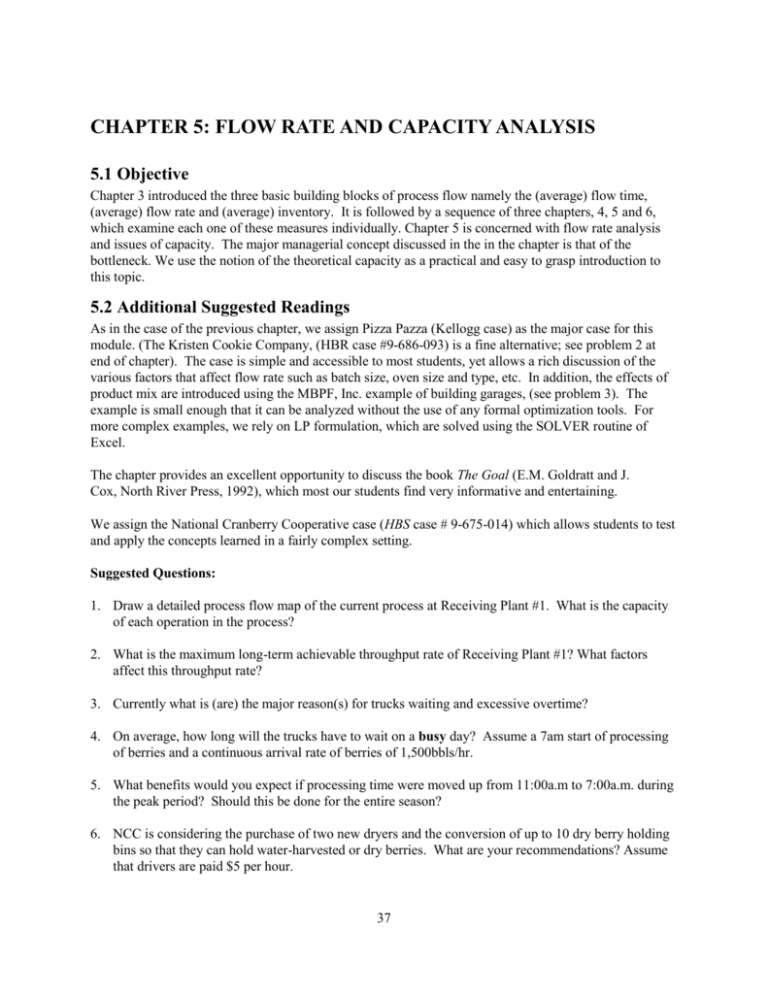
CHAPTER 5: FLOW RATE AND CAPACITY ANALYSIS 5.1 Objective Chapter 3 introduced the three basic building blocks of process flow namely the (average) flow time, (average) flow rate and (average) inventory. It is followed by a sequence of three chapters, 4, 5 and 6, which examine each one of these measures individually. Chapter 5 is concerned with flow rate analysis and issues of capacity. The major managerial concept discussed in the in the chapter is that of the bottleneck. We use the notion of the theoretical capacity as a practical and easy to grasp introduction to this topic. 5.2 Additional Suggested Readings As in the case of the previous chapter, we assign Pizza Pazza (Kellogg case) as the major case for this module. (The Kristen Cookie Company, (HBR case #9-686-093) is a fine alternative; see problem 2 at end of chapter). The case is simple and accessible to most students, yet allows a rich discussion of the various factors that affect flow rate such as batch size, oven size and type, etc. In addition, the effects of product mix are introduced using the MBPF, Inc. example of building garages, (see problem 3). The example is small enough that it can be analyzed without the use of any formal optimization tools. For more complex examples, we rely on LP formulation, which are solved using the SOLVER routine of Excel. The chapter provides an excellent opportunity to discuss the book The Goal (E.M. Goldratt and J. Cox, North River Press, 1992), which most our students find very informative and entertaining. We assign the National Cranberry Cooperative case (HBS case # 9-675-014) which allows students to test and apply the concepts learned in a fairly complex setting. Suggested Questions: 1. Draw a detailed process flow map of the current process at Receiving Plant #1. What is the capacity of each operation in the process? 2. What is the maximum long-term achievable throughput rate of Receiving Plant #1? What factors affect this throughput rate? 3. Currently what is (are) the major reason(s) for trucks waiting and excessive overtime? 4. On average, how long will the trucks have to wait on a busy day? Assume a 7am start of processing of berries and a continuous arrival rate of berries of 1,500bbls/hr. 5. What benefits would you expect if processing time were moved up from 11:00a.m to 7:00a.m. during the peak period? Should this be done for the entire season? 6. NCC is considering the purchase of two new dryers and the conversion of up to 10 dry berry holding bins so that they can hold water-harvested or dry berries. What are your recommendations? Assume that drivers are paid $5 per hour. 37 You may want to download (from http://www.prenhall.com/anupindi/) and use the Excel workbook NCC.xls to analyze this case. We have allowed the students to use the spreadsheet. In class we illustrate how one could analyze the case (without the spreadsheet) using inventory build-up diagrams. Answer: Remained unchanged since the bottleneck capacity is unaffected. 5.3 Answers to Questions 5.1 a. At 50% product mix, the Unit load at each department is given Unit Load Shopping Unit Load Unit Load Medical Mix (hours per contract) (hours per contract (hrs per contract) Paralegal 4 6 5 Tax lawyer 1 3 2 Senior partner 1 1 1 The capacity of the various departments is : Unit Load (hrs per contract) Hours Available (hours per day) Capacity (units per day) Paralegal 5 24 4.8 Tax lawyer 2 24 12 Senior partner 1 8 8 The capacity of the process is 4.8 contracts per day. b. Assuming 20 working days in a month, the capacity is not sufficient c. The number of professionals required is given by: Unit Load Hours required Hours Available (hours per professional per month) Number of Professionals required (hrs per contract) (hours per 150 contracts Paralegal 5 750 120 6.25 Tax lawyer 2 300 160 1.875 Senior partner 1 150 80 1.875 These could be rounded up to 7, 2 and 2 professionals respectively. 5.2 a. The capacity of shopping cases is 24/4 = 6 cases per day and the capacity of medical cases is 24/6 = 4 cases per day. The contribution from shopping cases is 6* 4000 = $24,000 per day and from medical cases is 4*5000 = $20,000 per day. Shopping is more profitable. b. The capacity is 4.8 cases per day, and the margin per unit is 0.5*5000 + 0.5*4000 = $4500 per case. The margin at capacity is 4.8 * 4500 = $21,600 per day c. The profit at capacity is (21,600* 20) –-500,000 = –68,000 (a loss) d. An extra paralegal will increase the capacity by 120/5= 24 cases per month. This is worth 24*4500 = $108,000 per month (less the cost of the paralegal) 5.3 a. The capacity is 6 customers per hour: The unit load from the three hair stylists is 10+ 15 +5 = 30 minutes per customer. Checking in (LuLu) takes 3 minutes. Thus, the capacity of the stylists is 3 * 60 /30 = 6 customers per hour, and of LuLu is 1* 60/3 = 20 customers per hour. The bottleneck are the stylists. b. The theoretical capacity will increase to 7.2 customers per hour: If LuLu does the billing, the unit load of the stylists is reduced to 25 minutes per customer, and their theoretical capacity increases to 3* 60/ 25 = 7.2 customers per hour. On the other hand, Lulu’s unit load increases to 3+5 = 8 minutes per hour, and her capacity decreases to 60/8=7.5 customers per hour. 5.4 a. A is more profitable : The capacity of A and B respectively are 900/10= 90 and 900/20= 45 units per day. The margin capacity of the two products are 90*20 =$1800 and 45*35 = $1575 per day respectively. b. The unit load of the mix is 60%*10 +40%*20 = 14 minutes per unit. The capacity is 900/14 = 64.3 units per day c. The margin per unit is 60%*20+40%*35= $26 per unit. The financial capacity is 64.3*26 = $1671.42 per day. 5.5 Insurance Company One should average the reciprocal of the capacities : (500 + 1000)/2 = 1500/2 = 750 5.6 a. The variable cost is 33%*15 = $5 million per month. The throughput profit multiplier is (18 –5)/(18-15) = 13/3= 4.3 5.7 a. The theoretical capacity is 6.00 cases per day: Capacity Waste Theoretical capacity (units per day) Paralegal 4.8 20% 4.8/(1-0.2)= 6.00 Tax lawyer 12 30% 12/(1-0.3)= 17.14 Senior partner 8 35% 8/(10.35)=12.31 Suggested Exam for Chapters 4 and 5: 1. The “Steal a Deal” gift shop specializes in heavily discounted merchandise for the holiday season. The store prices are so appealing that lines of people queue up in the early AM hours in front of the store doors in order to secure a place in the line. On the morning after Thanksgiving, one of the busiest days of the year, the store opened its doors at 8:00AM. At that time there were 120 customers already waiting in line. From 8:00AM to 10:00AM, new customers arrive at the rate of 5 per minute. After 10:00AM, the rate reduces to 2 per minute. The store admits customers at the rate of 4 per minute. a. Jacob plans to arrive to the store at 9:00AM. How long should he expect to wait? b. Rachel does not want to wait more than 15 minutes. When should she show up? 2. EZS is a small fast food outlet located in midtown Manhattan and serving mainly the corporate clientele. EZS’ main fare is a freshly prepared, customizable line of sandwiches. It is supplemented with an assortment of drinks, light salads, seasonal fruit and snacks. The restaurant is open 10:00AM to 10:00PM, but the peak demand is during lunch hours, 11:30 to 2:00PM. A customer joining the line makes a sandwich selection by consulting the billboard, marks her selection on a customized form, and hands the form to one of several assemblers who produce the sandwich. The customer does not wait for the sandwich to be assembled, but proceeds directly down the line to select additional items onto her tray. Next, the customer proceeds to pay at the cash register. Finally, (after the payment is completed) she collects her prepared sandwich at a designated location. Selecting the sandwich and marking the form takes 45 seconds. Assembling the sandwich requires 90 seconds. Selecting additional items takes 60 seconds. Paying at the cash register requires 40 seconds. Collecting the prepared sandwich requires 20 seconds. The restaurant employs 2 cash registers and 6 sandwich assemblers, and one person to disburse the prepared sandwiches. a. b. c. d. Draw a process map What is the theoretical flow time of the process? What is the capacity of the process During rush hour, demand exceeds capacity and long lines form. Does it make sense to add a sandwich assembler? 3. A temp work service maintains an “inventory” of 200 computer specialists who are assigned to various customers on a short term basis. The typical tour of duty lasts for 7 weeks, and the period between assignments typically lasts for 3 weeks. Assume 50 weeks per year. a. On average, how many specialists start on a new assignment each week? b. On average, how many specialists are idle (between assignments)? 4. A company’s income statement for FY06 contains the following information (in $ Million): Revenue COGS SGA&O Profit 700 400 200 100 It is estimated that 20% of COGS and 10% of SGA&A are Throughput Cost (vary with throughput), and the rest are Capacity Cost ( fixed with respect to throughput). The throughput is 100,000 units per year. a. What will be the increase in profit if throughput increases by 1%? Exam Solutions: Problem 1: At 8:00Am, 120 customers are waiting From 8:00 to 10:00AM, line increase by 1 customer per minute From 10:00 to 12:00PM, line decrease by 2 customers per minute a. At 9:00 the line is 180. Jacob will wait 180/4 = 45 minutes b. To wait 15 minutes, the line has to be at most 15*4 = 60. Rachel must show up after 11:30AM Problem 2: a. b. The critical path is the top one, = 45 +60 + 40 +20 = 165 sec c. Capacity per minute: Assembly: 6*60/90 = 4 Cash register 2*60/40 = 3 Disburse 1*60/20= 3 (assuming time to collect = time to disburse) d. No. Assembler is not a bottleneck Problem 3: a. The flow time of entire process is 3+7 = 10 weeks Inventory is 200 Therefore R= I/t = 200/10 = 20 per week b. The flow time of “idle” is 3 weeks The throughput is 20 per week Therefore I=R*T= 20*3 = 60 Alternative way % of idle time 3/10= 30%. Thus 30% of staff will be idle on average, ( 30% of 200 = 60) Problem 4: a. First we need to separate the total cost (COGS +SGA&O) into throughput cost and capacity cost Throughput cost = 20% * 400 + 10% * 200 = 100 ($M per year), The rest ($500M) is capacity cost Throughput is 100,000 units per year. Thus, we have, In $ per unit: Profit= 100M/100K= 1000 Revenue= 700M / 100K = 7000 Throughput cost = 100M/ 100 K = 1000 Margin per unit = 7000- 1000 = 6000 Throughput profit multiplier = 6000/1000 = 6 Alternatively, compute directly: Revenue will increase by 1% of 700M = 7M Cost will be increase by 1% of 100M = 1M (only Throughput cost) Profit will increase by 7M-1M = 6M, a 6% increase


