EPAPS_final - AIP FTP Server
advertisement
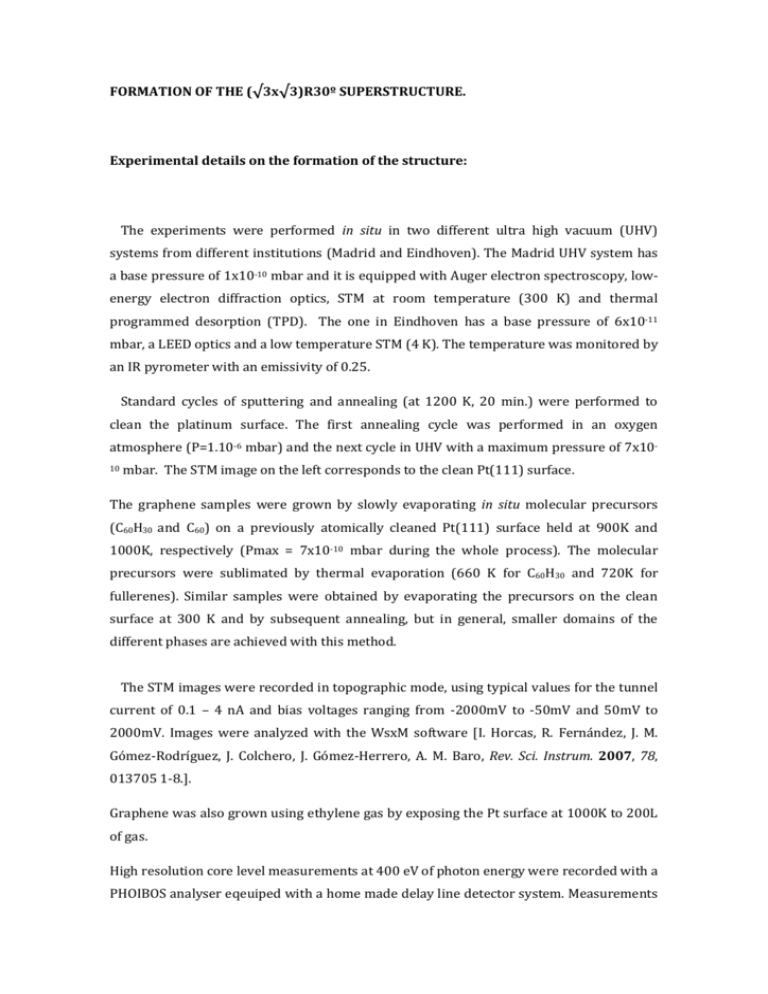
FORMATION OF THE (√3x√3)R30º SUPERSTRUCTURE. Experimental details on the formation of the structure: The experiments were performed in situ in two different ultra high vacuum (UHV) systems from different institutions (Madrid and Eindhoven). The Madrid UHV system has a base pressure of 1x10⁻¹⁰ mbar and it is equipped with Auger electron spectroscopy, lowenergy electron diffraction optics, STM at room temperature (300 K) and thermal programmed desorption (TPD). The one in Eindhoven has a base pressure of 6x10-11 mbar, a LEED optics and a low temperature STM (4 K). The temperature was monitored by an IR pyrometer with an emissivity of 0.25. Standard cycles of sputtering and annealing (at 1200 K, 20 min.) were performed to clean the platinum surface. The first annealing cycle was performed in an oxygen atmosphere (P=1.10-6 mbar) and the next cycle in UHV with a maximum pressure of 7x10¹⁰ mbar. The STM image on the left corresponds to the clean Pt(111) surface. The graphene samples were grown by slowly evaporating in situ molecular precursors (C60H30 and C60) on a previously atomically cleaned Pt(111) surface held at 900K and 1000K, respectively (Pmax = 7x10⁻¹⁰ mbar during the whole process). The molecular precursors were sublimated by thermal evaporation (660 K for C60H30 and 720K for fullerenes). Similar samples were obtained by evaporating the precursors on the clean surface at 300 K and by subsequent annealing, but in general, smaller domains of the different phases are achieved with this method. The STM images were recorded in topographic mode, using typical values for the tunnel current of 0.1 – 4 nA and bias voltages ranging from -2000mV to -50mV and 50mV to 2000mV. Images were analyzed with the WsxM software [I. Horcas, R. Fernández, J. M. Gómez-Rodríguez, J. Colchero, J. Gómez-Herrero, A. M. Baro, Rev. Sci. Instrum. 2007, 78, 013705 1-8.]. Graphene was also grown using ethylene gas by exposing the Pt surface at 1000K to 200L of gas. High resolution core level measurements at 400 eV of photon energy were recorded with a PHOIBOS analyser eqeuiped with a home made delay line detector system. Measurements were performed in normal emission conditions and with an overall energy resolution of 50 meV. Fitting of the data was performed with Doniach Sunjich functions convoluted with gaussian broadening. Fitting parameters for the narrow C1s peaks for both preparation conditions are the same, whereas the small components for the sample prepared out C60 are slightly broader. Theoretical details for the calculations a.- DFT. Density functional theory has been used to compute equilibrium geometries and their corresponding electronic structure [P. Hohenberg and W. Kohn, Phys. Rev. 136, B864 (1964)]. Wavefunctions are expanded in plane-waves as implemented in the CASTEP program [S.J. Clark, M.D. Segall, C.J. Pickard et al., Z. Kristallogr. 220, 567 (2005); http://www.accelrys.com] up to a cutoff of 350 eV and are sampled on a Monkhorst-Pack 6x6x1 mesh inside the Brillouin zone [H.J. Monkhorst and J.D. Pack, Phys. Rev. B 13, 5188 (1976)]. C and Pt atoms are described by ultra-soft pseudopotentials [D. Vanderbilt, Phys. Rev. B 41, 7892 (1990)] and the local density approximation is used for the exchange and correlation potential. [D.M. Ceperley and B.J. Alder, Phys. Rev. Lett. 45, 566-569 (1980)]. Bulk fcc Pt has been optimized separately on a 8x8x8 Monkhorst-Pack to give an equilibrium lattice value of 3.917 Ang (exp. value is 3.92 Ang) for a residual stress less than 0.001 GPa and negligible residual forces. The choice of a LDA exchange and correlation functional has little influence, as shown by a Generalized Gradients Approximation based in Perdew-Wang-91 that results in lattice parameter 1/100 larger than the experimental one. Similarly, description of a single graphene layer with this formalism is very good, resulting in an equilibrium 2D lattice parameter for the rhombohedral unit cell of 2.439 Ang (2.438 Ang for PW91), to be compared with the value for graphite (2.461 Ang). The Pt(111) surface has been modeled by a seven-layers slab that converges to a 2D lattice parameter shorter than the projected bulk value by 0.5/100. b.- STM To simulate STM images we use the non-equilibrium Keldysh’s Green-functions formalism [L.V. Keldysh, Zh. Eksp. Teor. Fiz. 47, 1515 (1964)] as implemented by Flores et al. [F. Flores et al., Progress in Surf. Sci. 48, 27 (1995)] . In this formalism, the Hamiltonian of the problem is written as the superposition of two sub-systems solved independently (Tip and Sample) and a term describing their interaction: H HT HS HI The tunnelling current is computed using the density of states on both the Tip and the Sample, and some effective hopping matrices that contain up to any order the multiple scattering between the Tip and the Sample. This effect is important when the Tip-Sample separation is small and it is responsible for the saturation of the current when a contact is established. The expression can be written as [e.g. eq. 30 and 29 in [J.M. Blanco, F. Flores, R. Perez, Progress in Surf. Sci. 81, 403 (1996)]: J 4e EF e V Tr T ~e f f ( E )T~e f f ( E eV ) dE T S S S S T T T EF In our calculation, the effective hopping includes all the multiple scattering terms, i.e., the probability for one electron to be propagated from the tip to the sample including all the processes with different number of electronic reflexions in both subsystems: A T~Te S f f I TT Sg SA T S S Tg T 1 T A TT S TT S TT Sg SA T TT S . . . S S Tg T T STEP ROUNDING PROCESS. Step 2 shows incomplete coverage for a better appreciation of the substrate steps. In order to achieve a complete coverage of the sample with 1ML of graphene, more than 3ML were deposited. DENSITY OF STATES (DOS) OF THE MOIRE AND (√3X√3)R30º STRUCTURES Comparison between DOS of the Moire structure and our proposed (√3x√3)R30º : a)Ptatoms contributions: the Pt-hollow (red circles) has bigger values (around the Fermi energy) than the prototypical Pt-atom (black squares) below the Moire, which is similar to the Pt-top (green triangles) on our model. This large DOS of Pt-hollow atom explains the bright spot in the STM image and the less brilliant one for the second Pt. b) C-atoms contributions: Moire’s (blue triangles) contributes less than the C-over the vacancy (green diamonds). Its influence on the STM current is due to this incresead DOS. The brown diamonds corresponds to C on top Pt (the other 6 C-atoms have similar DOS contributions, and are small enough to not be observed in the STM image). QUANTITATIVE AGREEMENT IN THE CALCULATED AND EXPERIMENTAL STM IMAGES The simulated and experimental STM images in Fig. 3 not only agree on all the significant visual features over the 2D scan region, but a semi-quantitative agreement can be sustained by analyzing a scan profile along a line going through the unit cell (blue line). Leaving aside the small noise level and lateral drift (that can be estimated by comparing equivalent peaks), three maxima (M1, M2 and M3) and three minima can be identified in the experimental (black continuous line) and theoretical profiles (blue dashed line) that admit a one to one correspondence not easy to find on theoretical simulations of experiments on complex surfaces.

