Lab 7
advertisement
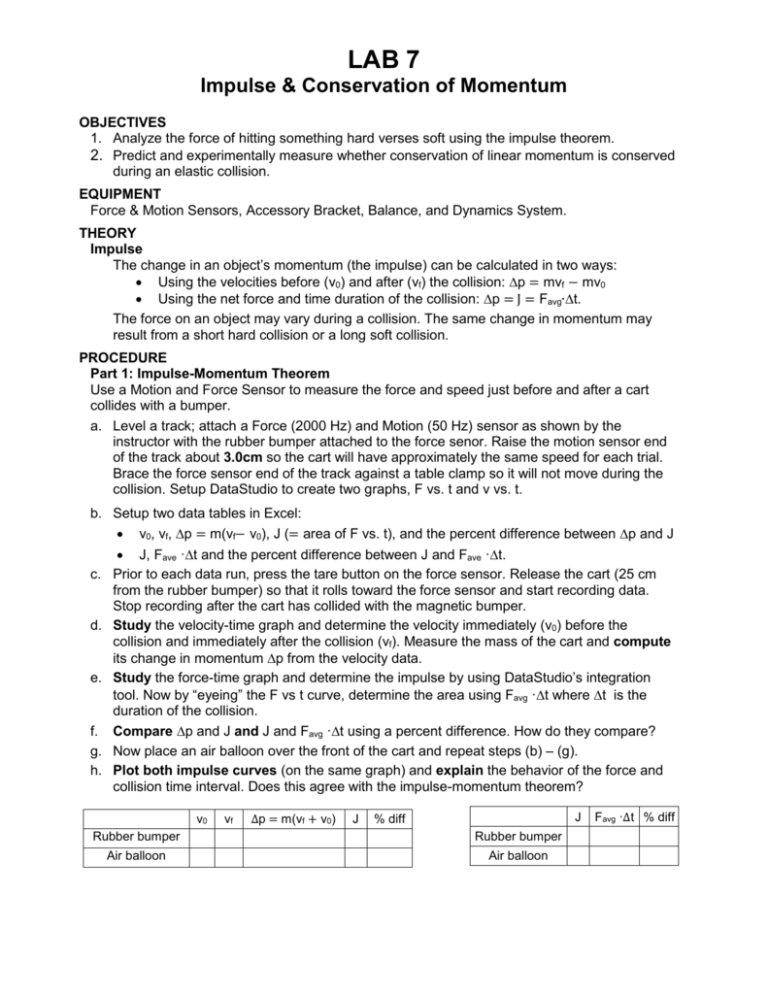
LAB 7 Impulse & Conservation of Momentum OBJECTIVES 1. Analyze the force of hitting something hard verses soft using the impulse theorem. 2. Predict and experimentally measure whether conservation of linear momentum is conserved during an elastic collision. EQUIPMENT Force & Motion Sensors, Accessory Bracket, Balance, and Dynamics System. THEORY Impulse The change in an object’s momentum (the impulse) can be calculated in two ways: Using the velocities before (v0) and after (vf) the collision: p = mvf − mv0 Using the net force and time duration of the collision: p = J = Favg∙t. The force on an object may vary during a collision. The same change in momentum may result from a short hard collision or a long soft collision. PROCEDURE Part 1: Impulse-Momentum Theorem Use a Motion and Force Sensor to measure the force and speed just before and after a cart collides with a bumper. a. Level a track; attach a Force (2000 Hz) and Motion (50 Hz) sensor as shown by the instructor with the rubber bumper attached to the force senor. Raise the motion sensor end of the track about 3.0cm so the cart will have approximately the same speed for each trial. Brace the force sensor end of the track against a table clamp so it will not move during the collision. Setup DataStudio to create two graphs, F vs. t and v vs. t. b. Setup two data tables in Excel: v0, vf, p = m(vf− v0), J (= area of F vs. t), and the percent difference between p and J J, Fave ·t and the percent difference between J and Fave ·t. c. Prior to each data run, press the tare button on the force sensor. Release the cart (25 cm from the rubber bumper) so that it rolls toward the force sensor and start recording data. Stop recording after the cart has collided with the magnetic bumper. d. Study the velocity-time graph and determine the velocity immediately (v0) before the collision and immediately after the collision (vf). Measure the mass of the cart and compute its change in momentum p from the velocity data. e. Study the force-time graph and determine the impulse by using DataStudio’s integration tool. Now by “eyeing” the F vs t curve, determine the area using Favg ·t where t is the duration of the collision. f. Compare p and J and J and Favg ·t using a percent difference. How do they compare? g. Now place an air balloon over the front of the cart and repeat steps (b) – (g). h. Plot both impulse curves (on the same graph) and explain the behavior of the force and collision time interval. Does this agree with the impulse-momentum theorem? v0 vf ∆p = m(vf + v0) J J % diff Rubber bumper Rubber bumper Air balloon Air balloon Favg ·∆t % diff Part 2: Applications of the Impulse-momentum theorem The power of the impulse-momentum theorem is its ability to estimate the average force (Favg), velocity and time of how long the force was applied: J p Favg t mv f mv 0 a. Measuring impact forces Predict which ball, SuperBall verses a clay ball, will hit the ground with a larger impact force when both are dropped from a 2-meter height above the ground? i. Now drop one ball at a time and measure the impact force by dropping it from a 2meter height above a force plate sensor. ii. With these impact force values, with the help of the instructor, estimate the contact time (of the SuperBall and clay ball) with the force plate sensor using the impulsemomentum theorem. Do these times agree with what you expected? Explain with short concise sentences. If you were to jump from a step stool onto a force sensor plate, predict which jump would have a larger impact force: a jump where you bend your knees a lot verses not bend very much? Testing your prediction and comment on the impact force values and contact times. b. Predicting the time to reach a certain speed Apply an impulse (0.4 N force for a time of ∆t) to a cart and estimate the amount of time (∆t) required to bring the cart from rest (v0 = 0) to a speed of vf = 0.60 m/s. Use the impulsemomentum theorem to predict the required time. c. Measuring the average force of running Estimate the average force required to change your initial momentum (p0 = 0) to a final momentum (pf = mvf); that is, the force required to accelerate from rest to a maximum speed of v1. Measure the times and distances for the two above intervals setup in the table below: ∆t1 a≠0 ∆x1 ∆v1 a=0 ∆t2 ∆x2 ∆v2 Using the impulse-momentum theorem determine the average force you exerted during the impulse period: mv Favg t1 mv1 mv 0 Favg 1 t1 Application: Usain Bolt holds the world record in the 100-m dash at 9.58 s. Using the graphs of Bolt's performance (http://www.sportsscientists.com/2009/08/analysis-of-bolts-958wr.html), can you estimate his average force during his acceleration time between 20-meters to 40-meters?
