Most computer output reports are a mixture of "constant" data which
advertisement
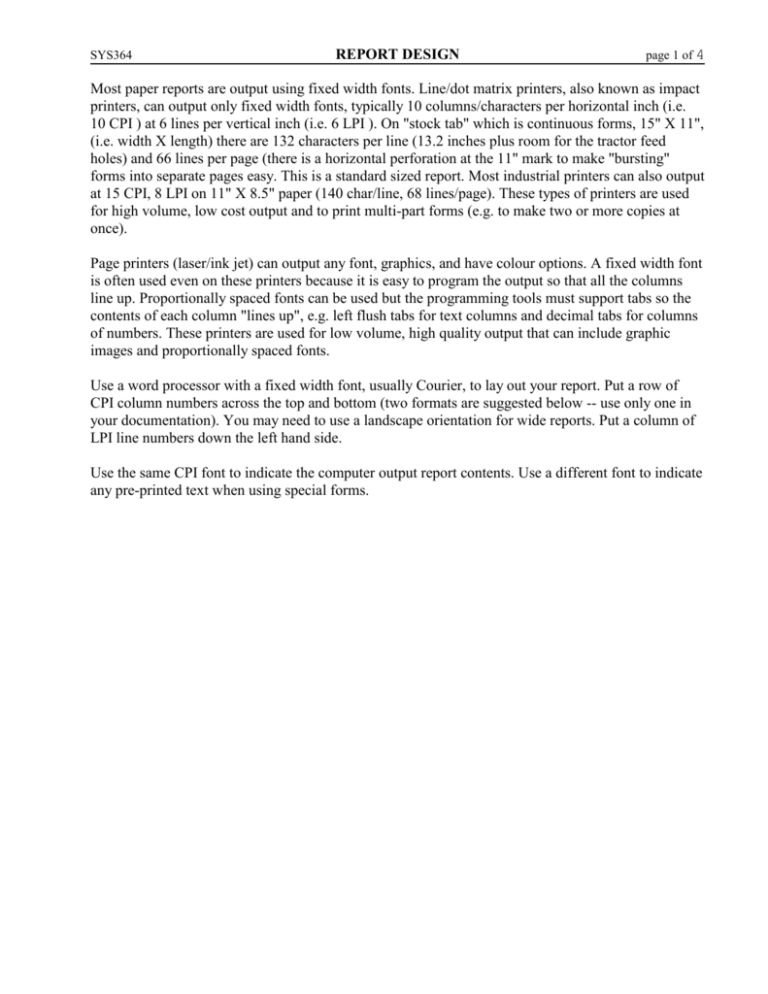
SYS364 REPORT DESIGN page 1 of 4 Most paper reports are output using fixed width fonts. Line/dot matrix printers, also known as impact printers, can output only fixed width fonts, typically 10 columns/characters per horizontal inch (i.e. 10 CPI ) at 6 lines per vertical inch (i.e. 6 LPI ). On "stock tab" which is continuous forms, 15" X 11", (i.e. width X length) there are 132 characters per line (13.2 inches plus room for the tractor feed holes) and 66 lines per page (there is a horizontal perforation at the 11" mark to make "bursting" forms into separate pages easy. This is a standard sized report. Most industrial printers can also output at 15 CPI, 8 LPI on 11" X 8.5" paper (140 char/line, 68 lines/page). These types of printers are used for high volume, low cost output and to print multi-part forms (e.g. to make two or more copies at once). Page printers (laser/ink jet) can output any font, graphics, and have colour options. A fixed width font is often used even on these printers because it is easy to program the output so that all the columns line up. Proportionally spaced fonts can be used but the programming tools must support tabs so the contents of each column "lines up", e.g. left flush tabs for text columns and decimal tabs for columns of numbers. These printers are used for low volume, high quality output that can include graphic images and proportionally spaced fonts. Use a word processor with a fixed width font, usually Courier, to lay out your report. Put a row of CPI column numbers across the top and bottom (two formats are suggested below -- use only one in your documentation). You may need to use a landscape orientation for wide reports. Put a column of LPI line numbers down the left hand side. Use the same CPI font to indicate the computer output report contents. Use a different font to indicate any pre-printed text when using special forms. page 2 of 4 REPORT DESIGN SYS364 10 CPI, 6 LPI. 15" X 11" standard forms: 1 2 3 4 5 6 7 123456789012345678901234567890123456789012345678901234567890123456789012345 ....+....1....+....2....+....3....+....4....+....5....+....6....+....7....+ 01 02 2001-01-17 11:25 Product Inventory PAGE 1 03 as of Dec. 2000 Month End 04 05 06 Prod Product Description Qty On Total Total 07 Type Number Hand Cost Retail 08 999 999999 XXXXXXXXXXXXXXXXXXXXXXXX 9,999 99,999.99 99,999.99 09 10 TOTAL 999,999- 999,999.99- 999,999.9911 12 FINAL TOTALS 13 9,999,999-9,999,999.99-9,999,999.9914 PRODTYPE PRODNO DESCRP QTYOH qtyoh*avgcst qtyoh*sellpr Sample data: 1 110110 110111 110112 110115 386 VGA COLOR LEAD. EDGE 386 SUPER VGA LEAD. EDGE 386 LAPTOP, LEAD. EDGE NOTEBOOK, LEAD. EDGE TOTAL 2 110310 TOSHIBA T1200KE 110321 TOSHIBA T3200SK ... TOTAL 10 5 10 1 8,500.00 4,950.00 14,400.00 1,600.00 12,950.00 7,475.00 18,970.00 2,195.00 26 29,450.00 41,590.00 7 6 7,700.00 12,474.00 11,193.00 19,194.00 13 20,174.00 30,387.00 FINAL TOTALS TOTAL 1,729 R E P O R T * * * 158,938.50 239,006.55 65 * * * E N D O F 66 123456789012345678901234567890123456789012345678901234567890123456789012345 1 2 3 4 5 6 7 Data Source: RPG455LIB/CSINVP table (see above for column names) Sequence: Break: PRODTYPE, PRODNO PRODTYPE Comments: * PRODTYPE printed only on first line of control break or on page overflow * only non-zero QTYOH product rows are printed * user can select as at: Month End year/month or current date Frequency: automatically as part of month end processing job or on demand from user menu. Distribution: accountant SYS364 REPORT DESIGN page 3 of 4 Most computer output reports are a mixture of "constant" data -- titles and column headings on every page, and variable data which comes from the input file(s) or tables read by the program. Constant data may be pre-printed in the case of special forms like invoices or is output from the program in the case of internal reports on standard forms (e.g. "stock tab" or plain paper). Your layout must clearly indicate the difference between computer output and pre-printed text on special forms. (See the FONTS document for an example.) The most common type of computer output report is the columnar tabulation, certainly not the only type of report! A columnar report typically has the following format: Page Header line(s) showing report title, effective date(s), run date, page number Note the difference between effective date of report and run date when printed! Column Heading line(s) showing labels for the subsequent detail lines Group Header lines showing code and description of each group (Control break) Detail lines, aligned with the Column Headings, numbers left aligned by decimal point Group Summary lines showing subtotals of detail lines Grand Total Summary line (last page only) Textual data (e.g. names) are printed with column headings and data left adjusted. Numeric data and headings are left adjusted. The telephone book is a good example of this in the case of name and phone number, but not for the address. For multi-level control break reports, some reports have page breaks on the major control break, so that the Page Header includes the Group Header information. Group summaries often show asterisks (*) after totals to indicate the group level (* for minor, ** for intermediate, *** for major). Many control break reports suppress identifier or descriptive fields (or similar detail) on every line after the first line of the group, “group indication”. When space is tight, each summary line may instead be two lines, with totals staggered (because the total is wider than the column detail).. Another way to reduce columns is pre-ruled forms (to save blanks between columns). These are typically expensive both for custom stationery, and for operator effort, although some laser printers will permit superimposing form rulings and headings while printing, to provide custom stationery effects with no stationery costs. Another approach to reducing space consumption is to scale values, reporting by $1000 instead of by $.cc as usual. As an alternative to the columnar type of tabulation, a report may instead have labeled fields, with one or more lines per input record, each field identified by its own label, (instead of the column headings labeling all the fields in the same column). Field labels, also called “captions”, may be right- or left-justified, with the data usually right-justified, but occasionally left-justified with rightjustified labels, so that a group of lines is aligned on the colon (:) or hyphen(-) between label and data. Some reports have the labels placed above the data, instead of to its left. Reports are usually designed for 8½” by 11” paper (letter size), or 8½” by 14” paper (legal size), or 15” by 11” continuous forms (stock tab). Some stock tab is preprinted with light colour bars every half inch (3 or 4 lines) to assist the reader. Because unusual sizes mean higher cost paper and the use of non-standard folders, clamps, binders, etc., for the system user and extra effort for the computer operations staff, it is worth the effort to make most reports fit the standard paper sizes. SYS364 REPORT DESIGN page 4 of 4 Designing an output report may be done on paper, using Printout Layout forms and COBOL format (PICTURE) symbols, or on the computer, using either PIC symbols or sample data. Designs on paper may be more convenient for some purposes, because room can be found to annotate with font styles and types, colours, etc. Many designers prefer to work on the computer, because of the ease of modifying the design as it is being developed. As specifications for the programmers, the PICTURE approach is usually preferred, but for gaining user feedback on the design, the sample data approach is preferable. Either approach is suitable for most systems work, but local standards may be imposed.

