Student Handout: Phytoplankton and Harmful Algal Blooms (HABs):
advertisement
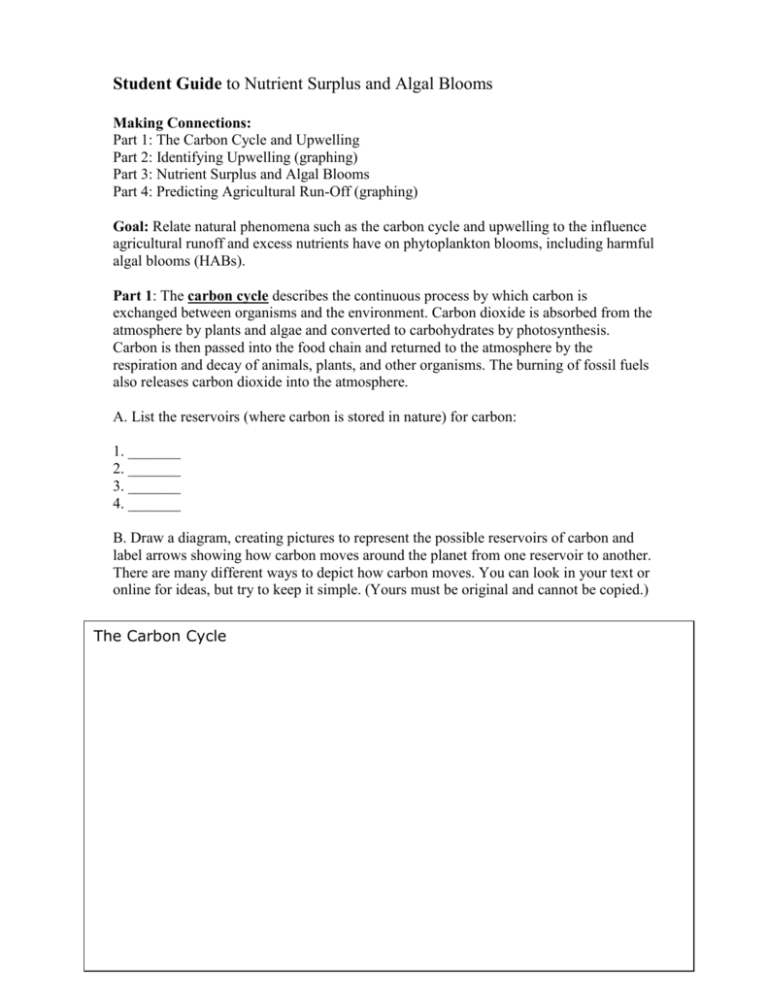
Student Guide to Nutrient Surplus and Algal Blooms Making Connections: Part 1: The Carbon Cycle and Upwelling Part 2: Identifying Upwelling (graphing) Part 3: Nutrient Surplus and Algal Blooms Part 4: Predicting Agricultural Run-Off (graphing) Goal: Relate natural phenomena such as the carbon cycle and upwelling to the influence agricultural runoff and excess nutrients have on phytoplankton blooms, including harmful algal blooms (HABs). Part 1: The carbon cycle describes the continuous process by which carbon is exchanged between organisms and the environment. Carbon dioxide is absorbed from the atmosphere by plants and algae and converted to carbohydrates by photosynthesis. Carbon is then passed into the food chain and returned to the atmosphere by the respiration and decay of animals, plants, and other organisms. The burning of fossil fuels also releases carbon dioxide into the atmosphere. A. List the reservoirs (where carbon is stored in nature) for carbon: 1. _______ 2. _______ 3. _______ 4. _______ B. Draw a diagram, creating pictures to represent the possible reservoirs of carbon and label arrows showing how carbon moves around the planet from one reservoir to another. There are many different ways to depict how carbon moves. You can look in your text or online for ideas, but try to keep it simple. (Yours must be original and cannot be copied.) The Carbon Cycle C. Upwelling: As winds blow across the ocean surface and pushes water away, colder nutrient-rich water on the bottom then rises up to replace the water that was pushed away. This is unusual as normally warmer waters stay at the surface and colder, more dense water sinks towards the bottom. Nutrients on the seafloor (from the decomposition of organisms) are brought up during upwelling. Draw and label upwelling onto Figure 1: Include arrows for: Upwelling Wind Include labels for: Land Sea water Ocean floor Cold water Nutrients Figure 1- Coastal Upwelling Making Connections: Link the concept of photosynthesis and algae to the global carbon cycle and upwelling by understanding the role phytoplankton play in the uptake of carbon. 1. On a projector or in a computer lab, watch the animation that helps explain the role phytoplankton play in the carbon cycle on the website, by clicking on the image: http://www.nwfsc.noaa.gov/hab/habs_toxins/phytoplankton/algal_dynamics.html 2. While watching it, try to identify which parts of the animation show which step in photosynthesis. How many steps did you see? 3. Now sit in pairs and watch the video again; during the animation, try to tell each other what is happening at each step, but don’t write anything down yet. 4. Now watch it again, only this time, try to describe what happens at each step as you and your partner see it. Phytoplankton photosynthesis: 1. 2. 3. 4. 5. Check for understanding: 1. How do plankton reduce carbon dioxide levels in the atmosphere? 2. How do plankton increase oxygen levels in the atmosphere? 3. How is phytoplankton on the ocean different than plants on land? Part 2: Identifying Upwelling and Nutrient Surplus Making Connections: Graphing Activity Introduction: The natural process of upwelling occurs when warm surface water is pushed by wind, allowing cooler, more nutrient rich water to rise to the surface. How can we determine if and when upwelling occurs? Scientists look at various sets of data to determine natural patterns (and sometimes unnatural patterns) in the ocean. Making a Hypothesis: 1. Look at the data table for seasonal temperatures and ocean variations collected from a buoys located around Monterey Bay, CA in 2002. What variables were measured? 2. Look for patterns in the data. Did any levels increase as others decreased? Can you find any relationships between the variables, such as temperature and nitrate concentrations? 3. Make a hypothesis for the relationship between temperature and one other variable from the data chart: __________________________________________________________________ __________________________________________________________________ __________________________________________________________________ 4. Graph the temperature fluctuation from January 2002 to December 2002. a. Use a pencil and a ruler to plot changes in temperature on the y-axis and the months on the bottom of the x-axis (Remember: the temperature only varies by about 7 F throughout the year, so your whole y-axis should start with 50 F and end with about 60 F.) b. Connect the temperature changes over time and trace with a red pencil. 5. Sit in a group of four students. 6. In your group, each member will choose a different variable to graph on the yaxis (along with temperature): a. Nitrates b. Phosphates c. Silicates d. Iron e. Label the variable you graphed in color (green for nitrates, blue for phosphates, orange for silicates or black for iron, for example.) Make sure you use this color to add a key at the bottom of the page. Results: 7. Are there any patterns? Do you see any changes through the year? Describe the pattern. a. In what months is this resource abundant? b. In what months is it scarce? c. How is this resource related to upwelling? d. How is it used in the food web? e. What organisms might be affected if this resource is abundant? f. How would these organisms be affected if this resource were scarce? g. What evidence do the graphs provide that tells us when upwelling is happening? Conclusions: 8. What inferences can you make from the data you graphed? Was your hypothesis correct? Why or why not? 9. What is the difference between upwelling and agricultural run-off? 10. What variable could scientists measure and add to the data chart to determine if agricultural run-off was present? Part 3: Agricultural Run-off and Nutrient Surplus Reading Activity: Focus on the following question as you read the passage below: “What makes marine algae grow so fast and why is it a problem for marine environments?” QuickTime™ and a TIFF (Uncompress ed) dec ompres sor are needed to s ee this pic ture. What is an algal bloom? An algal bloom is a rapid Phytoplankton live in a very dynamic increase in the number of algal cells that dominate the environment. The ocean is always moving and planktonic community. A “bloom” refers to a algae and nutrients move with it. Not only can population of phytoplankton whose population has regional circulation patterns affect the nutrient suddenly exploded, often becoming visible to the concentrations in the water, but also they can naked eye. actually physically concentrate or disperse What causes an algal bloom? Like land plants, algal cells. In addition, many algal species algae need certain things to grow – water, carbon thrive under only certain temperature and dioxide, sunlight and nutrients. Carbon dioxide is salinity conditions. And finally, for algae to plentiful in the marine environment, but sunlight bloom successfully, there must be a limited and nutrients can be scarce. Sunlight is available number of grazers (organisms that eat near the surface of the water, so algae grow readily plankton) in the area. After all, if there were when they can remain near the surface. Nutrients enough grazers to keep the algal population are abundant in areas of run-off where water flows under control, there wouldn’t be a bloom. over land and picks up minerals that are then (http://www.bigelow.org/edhab/pdf/building_bloom.pdf) carried to the sea. Why are some large algal blooms harmful? Some Algal blooms can form from natural Harmful algal blooms (HABs) can negatively processes and not all are harmful. Nutrients are impact organisms in a variety of ways that can plentiful in areas where cool, deep, nutrient-rich range from cell and tissue damage to organism waters are brought to the surface due to death. Some HABs are not toxic; they do not upwelling, tides or wind-driven mixing. When produce actual toxins that kill animals, but the algal cells get everything they need to grow, instead, create an environment that is unhealthy they can divide very rapidly and potentially create for other organisms. For example, with an a bloom, which can also be a food source for a access of nutrients, algae will grow a thick variety of marine organisms. layer on the water’s surface, preventing the light penetration and oxygen absorption An important component involved in necessary for underwater life. This process is our scenario above is bioaccumulation. referred to as eutrophication. Bioaccumulation is the process by which (http://www.bigelow.org/edhab/help_hab.html) compounds accumulate or build up in an Algae that produce potent toxins can organism at a rate faster than they can be cause toxic blooms, massive fish kills, marine broken down. Several organisms, including mammal deaths, and human illness. There are copepods, krill, mussels, anchovies, and several types of toxins produced by these mackerel, have been found to retain toxins harmful algae. Commonly, the toxins affect the from phytoplankton in their bodies. These functioning of nerve and muscle cells. Toxic organisms are often not affected by the toxins, blooms have been responsible for causing but act as vectors and transport the toxins up respiratory irritation and distress, diarrhea, the food web. There have been several cases of vomiting, numbness, dizziness, paralysis, and whale and sea lion illness and death attributed even death. to this process. In many cases the toxins can be transported through the food web to humans, How can a toxin in phytoplankton cells cause often through contaminated shellfish. The such serious illnesses in so many different toxins can impact humans in different ways organisms? The key is how the toxins move through leading to mild symptoms or even death. The the food web. Although a phytoplankton cell may toxins cause many illnesses, including only contain a tiny amount of toxin, imagine how Ciguatera Fish Poisoning, Diarrhetic Shellfish much toxin a copepod would contain if it ate dozens Poisoning, Neurotoxic Shellfish Poisoning, of phytoplankton cells a day! Now Paralytic Shellfish Poisoning, and Amnesic Imagine how much toxin a right whale would Shellfish Poisoning. contain if it ate thousands of those (http://www.bigelow.org/edhab/pdf/tracing_toxins.pdf) Copepods a day! Questions from Reading: 1. What are algal blooms? What causes an algal bloom to occur? 2. How can large algal blooms be harmful? 3. What is bioaccumulation? Part 4: Predicting Agricultural Run-Off Making Connections: Computer Graphing Activity Introduction: Algal Blooms can occur naturally from a surplus of nutrients during the process of upwelling or unnaturally when agricultural waste and fertilizers drain into the oceans along the coasts from rivers and other freshwater drainages. Along the coast of California, much of the soil very fertile and is considered an invaluable agricultural resource for growing crops. Unfortunately, sometimes this can pose a threat to marine life by contributing to large algal blooms. Large blooms will grow a thick layer on the water’s surface, preventing the light penetration and oxygen absorption necessary for underwater life causing eutrophication. Sometimes the large blooms can carry excess amounts of dangerous toxins, called Harmful Algal Blooms (HABs). Scientists are constantly measuring the nutrients and other abiotic factors along coastlines with sensitive sensors attached to sturdy buoys in order to understand and predict scientific phenomena like algal blooms. Goal: In this activity, you will look at some data collected from the Monterey Bay in California and predict where agricultural run-off could be occurring. Activity: 1. Begin by visiting the site: http://www.mbari.org Scan the site and see what is new. Click on “About MBARI” on the left side of the page. a. What is MBARI? Where in California is it located? What is their goal, in general? 2. Click on the tab along the top called “Ocean Observatories” or type http://www.mbari.org/moos/ into your browser. 3. Look at the map of Monterey Bay and the seafloor around it. Because of the special geologic history of California and the formation of the underwater canyon you see in the picture, Monterey Bay has some of the richest marine resources and opportunities for research in the world! Click on the “Land/Ocean Biological Observatory (LOBO)” square on the upper right of the picture or type http://www.mbari.org/lobo/default.htm into your browser. a. Drag the curser over the picture of Elkhorn Slough to uncover a graph. Examine the graph: what variables is the graph comparing over time? Where does the line spike? Where does is dip? b. Complete this sentence: “As nitrates levels_______, salinity levels appear to _______.” 4. Click on “Network Array” along the left-hand side of the page. Look at sensors placed at different parts of Elkhorn Slough, which is an outlet for fresh water from Salinas River. Which buoys might represent a similar setting as a pier, harbor and estuary (which you may have sampled if you participated in the plankton sampling activity)? a. Pier ___________ b. Harbor ________ c. Estuary ________ d. Where do you think agricultural nutrient run-off could be a problem? Why? 5. Click on the “Real-Time” data tab from the list on the left-hand side of the screen. 6. Look at the top of the screen for the network status of the buoys. Currently, L1, L3 and M1 are online for data comparison. These buoys are similar enough to the pier (M1), harbor (L1) and Estuary (L3) that was sampled in a previous activity, as they have similar environmental conditions. (If this is not the case when you are doing this activity, choose similar buoys that are online by referencing the maps.) a. At which of the three sites above would you expect to find higher nitrates (nutrients) and lower salinity (more fresh water from land)? b. Why would higher nitrate levels and lower salinity levels indicate run-off? 7. Graphing: Select “real-time data” from the left-hand column of the page. Choose the following option on the tables to create a graph, comparing nitrate and salinity levels at the three different sites: “How many graphs” = One “What dates?” = month ending on end date “End date?” = today (this will give a graph for the last month) Graph 1 = Select L01 X-variable = Date Y-variables = hold the control key to select both nitrates and salinity. Look at the bottom, right-hand corner of the screen and hit “send”. It may take a minute or two for your graph to load… 8. Analyze the graph and answer the following: a. Are there any obvious peaks or troughs for nitrate levels? When? b. Are there any obvious peaks or troughs for salinity levels? When? c. Do any peaks in nitrate levels correspond to any troughs in salinity levels? What could this mean? 9. Repeat the steps above, changing Graph 1 to L03. a. Are there any obvious peaks or troughs for nitrate levels? When? b. Are there any obvious peaks or troughs for salinity levels? When? c. Do any peaks in nitrate levels correspond to any troughs in salinity levels? What could this mean? 10. Repeat the steps above, changing Graph 1 to M1. a. Are there any obvious peaks or troughs for nitrate levels? When? b. Are there any obvious peaks or troughs for salinity levels? When? c. Do any peaks in nitrate levels correspond to any troughs in salinity levels? What could this mean? 11. Now change the number of graphs to 3. For graph 1, select L1, dates and select both nitrates and salinity For graph 2, select L03, dates and select both nitrates and salinity For graph 3, select M1, dates and select both nitrates and salinity Then hit “send” 12. Analysis and Conclusions: Comparing all three graphs side-by-side, answer the following questions in complete sentences: a. Which site has the most variation in salinity? Why might this be? (Reference maps of buoy locations if needed.) b. Which graph has the highest spike in nitrogen and the lowest spike in salinity? Why might this be? (Reference maps of buoy locations if needed.) c. Which site has the most consistent salinity level? Why might this be? d. Near which site would you expect to find the largest fertilizer run-off and algal blooms? Why?
