tetra_exercise
advertisement
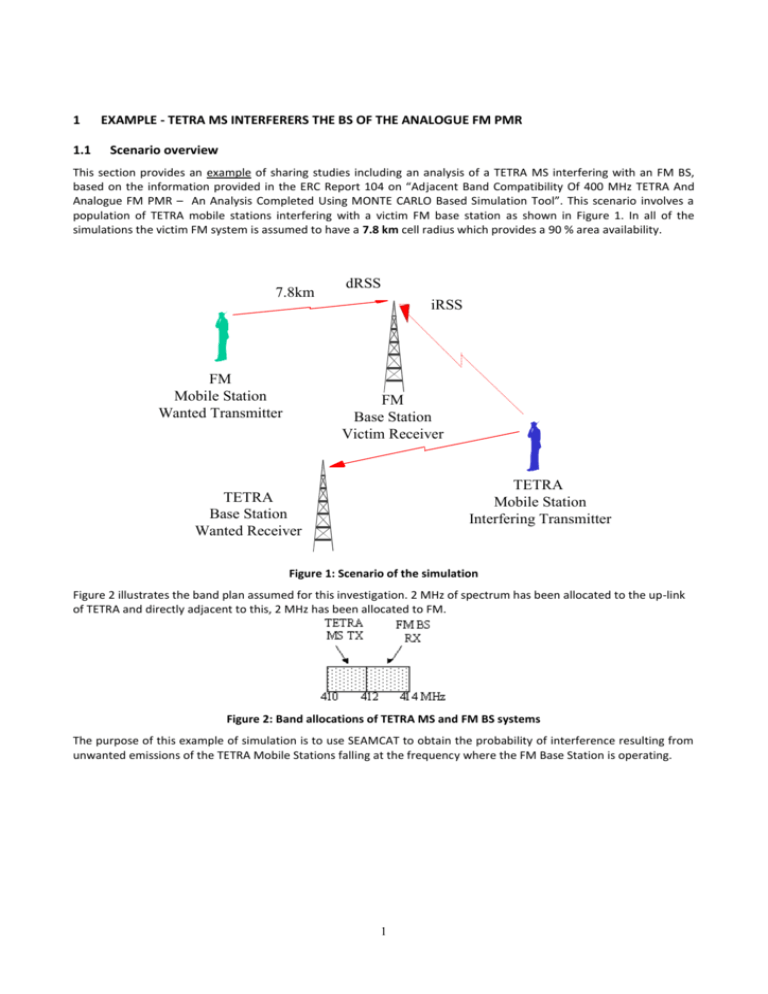
1 1.1 EXAMPLE - TETRA MS INTERFERERS THE BS OF THE ANALOGUE FM PMR Scenario overview This section provides an example of sharing studies including an analysis of a TETRA MS interfering with an FM BS, based on the information provided in the ERC Report 104 on “Adjacent Band Compatibility Of 400 MHz TETRA And Analogue FM PMR – An Analysis Completed Using MONTE CARLO Based Simulation Tool”. This scenario involves a population of TETRA mobile stations interfering with a victim FM base station as shown in Figure 1. In all of the simulations the victim FM system is assumed to have a 7.8 km cell radius which provides a 90 % area availability. 7.8km FM Mobile Station Wanted Transmitter dRSS iRSS FM Base Station Victim Receiver TETRA Mobile Station Interfering Transmitter TETRA Base Station Wanted Receiver Figure 1: Scenario of the simulation Figure 2 illustrates the band plan assumed for this investigation. 2 MHz of spectrum has been allocated to the up-link of TETRA and directly adjacent to this, 2 MHz has been allocated to FM. Figure 2: Band allocations of TETRA MS and FM BS systems The purpose of this example of simulation is to use SEAMCAT to obtain the probability of interference resulting from unwanted emissions of the TETRA Mobile Stations falling at the frequency where the FM Base Station is operating. 1 1.2 1.2.1 Characteristics of the systems Victim link characteristics – FM The victim FM system is assumed to have a 7.8 km cell radius which provides a 90% area availability. The reception bandwidth of the FM BS victim receiver is equal to 8 kHz. Based on information provided in ERC Report 104 for FM system based on 12.5 kHz channel spacing, the following characteristics are used to describe the FM equipment: Mobile Station Base Station Channel Spacing 12.5 kHz 12.5 kHz Transmit Power 37 dBm Receiver Bandwidth 8 kHz 44 dBm 8 kHz Antenna Height 1.5 m 30 m Antenna Gain 0 dBi 9 dBi Variable Variable - 107 dBm 21 dB - 110 dBm 21 dB Not used Not used Parameter Active Interferer Density Range Receiver Sensitivity Receiver Protection Criterion (C/I) Power Control Characteristic Table 1: Parameters assumed for 12.5 kHz FM systems Note 1: This exercise assumes that the noise floor is small compared to the interfering signal (I). Note 2: The Noise Floor can be obtained using the following equation (see ERC Report 68) Noise Floor = Sensitivity – Receiver Protection Ratio Frequency Offset Base Station Any frequency - 23 dBm Table 2: Receiver blocking for 12.5 kHz FM systems 1.2.2 Interfering link characteristics – TETRA The interfering TETRA system is assumed to have a 18 kHz emission bandwidth and a channel spacing which is equal to 25 kHz. The distribution in terms of frequency use over the 2 MHz band is taken as a uniform distribution, where each channel is being assigned the same probability. Based on information provided in ERC Report 104 for TETRA system based on 25 kHz channel spacing, the following characteristics are used to describe the TETRA equipments: Parameter Base Station Mobile Station Channel Spacing 25 kHz 25 kHz Transmit Power 30 dBm 40 dBm Receiver Bandwidth 18 kHz 18 kHz Antenna Height 1.5 m 30 m Antenna Gain 0 dBi 11 dBi Variable Variable Receiver Sensitivity - 103 dBm - 106 dBm Receiver Protection Criterion (C/I) 19 dB 19 dB 5 dB steps to a maximum of 15 dB. Threshold = - 86 dBm Not used Active Interferer Density Range Power Control Characteristic Table 3: Parameters used to model the TETRA systems Frequency Offset 30 dBm Mobile Station Attenuation in dBc 25 kHz - 30 dBm 60 50 kHz - 36 dBm 66 75 kHz - 36 dBm 66 100 - 250 kHz - 45 dBm 75 250 - 500 kHz - 50 dBm 80 > 500 kHz1 - 70 dBm 100 Table 4: Unwanted emissions for TETRA systems (measurement bandwidth of 18 kHz) (interfering transmitter) 1.3 Assumptions Starting from the characteristics provided above, some “reference” hypothesis might be used to obtain a first set of results. 1.3.1 Distribution of the Mobile Stations (MS) and propagation model It is assumed that all mobile stations are located uniformly distributed in the areas around their base stations. For worst case consideration a rural area may be assumed. 1.3.2 TETRA network A 2 MHz band is available for TETRA systems of 25 kHz channel spacing, therefore a total of 80 channels are available. It is supposed that only one TETRA MS terminal may use the same frequency at a given time. The frequency cluster is taken equal to 9, this leads to have 80/9 = 8.88 frequency per cell available. Then up to 9 terminals may be deployed in a TETRA cell. If the TETRA cell is a traffic limited network and the density of terminals is equal to 5 terminals per km², then the coverage radius is given by the following formula (see ERC Report 68 or User Documentation): 1 The level of unwanted emissions is supposed to be constant for frequency offset higher than 500kHz 3 Wanted Signal Wanted Signal Wanted Signal nchannels nuserperchannel densmax clusterfrequency wt Rmax Wanted Wanted The radius of the cell of the interferingSignal system is given by Signal V ictim R eceiver Wanted Signal V ictim R eceiver R = sqrt( (80*1) / (3.14*5*9) ) = 0.7523 km. Wanted Wanted Signal Signal Figure 3 describes a TETRA network based on the above assumptions. V ictim R eceiver R eceiver M o b i le ra d i o , i le reracdei iv o ,e -o n ly c a llm o d e ra d i o , -o n ly V ictim R eceiver M o b i le ra d i o , i le reracdei iv o ,e -o n ly M o b i le ra d i o , M o b i le ra d i o , i n a c a ll &V ictim i n a c a ll s p u rio u s in rx R eceiver V ictim b a n d w id t h M o b i le ra d i o , R eceiver i n a c a ll M o b i le ra d i o , M o b i le ra d i o , in a c a l l & i n a c a ll & s p u rio u s in v ic t im rx s p u rio u s in rx b a n d w id t h w it h l o we s t M coobui le ragdb ialo on,sdsw id t h p l in i n a c a ll & R=0.7523km M o bMi leo brai led i ra o ,d i o , i n a i nc aall c&a ll f28…f36 f1…f9 V ictim R eceiver V ictim s p u rio u s in rx b a n d w id t hM o b i le ra d i o , M o b i le iran dai oc,ain a call & ll & s p u rio u ss pinu rio v icutsiminrxrx b a n d w id t h w it h l o we s t M o b i le ra dc ioou,pinl inag clo a lsls& s p u rio u s in v ic t im rx f1…f9 b a n d w id t h TETRA Based Station f10…f18 f46…f54 Fre qu c o u p l in g lo s s f64…f72 f19…f27 s p u rio u s in rx b a n d w id t h f73…f80 f37…f45 b a n d w id t h w it h l o we s t c o u p l in g loMs so b i le ra d i o , in a c a l l & s p u rio u s in v ic t im rx b a n d w id t h w it h l o we s t b a n d w idbtahnw it hidltohwe s t dw c o u p l in g lo s s c o u p l in g lo s s M o b i le ra d i o , M o b i le ra d i o , in a c a l l & M o b i le ra d i o , M o b i le ra d i o , in a c a l l & M o b i le ra d i o , M o b i le ra d i o , i n a c a ll & s p u rio u s in v ic t im rx i len ly ra d i o , i n a c a ll & M o b i le ra d i o , s p u rio u s in vMic ot im re cMe ivo eb -o b i lerx ra d i o , in a c a l l & i n a c a ll s p u rio u s in rx b a n d w id t h w it h l o we s t n ea c a ll s p u rio u s in rx b a n d w id t h ws itphu rio l o we m oi d M o b i le ra d i o , i n a c a ll & u s sint v ic t im rx b a n d w id t h c o u p l in g lo s s b a n d w id t h s p u rio u s in rx c o u p l in g lo s bs a n d w id t h w it h l o we s t i n a c a ll c a llm o d e f55…f63 f10…f18 M o b i le ra d i o , in a c a l l & s p u rio u s in v ic t im rx enc TETRA Mobile Station yc f1…f9 lus f19…f27 ter o f9 Figure 3: TETRA network based on these assumptions 1.3.3 Interference situation As a worst case assumption, we may suppose that, the FM BS station will be based in the TETRA cell where the channel (411.9875 MHz) operating close to the edge of the TETRA band is used. The same probability is assigned to each channel available in the TETRA cell. Then the frequency plan in this cell starts from 410.0125 MHz up to 411.9875 MHz with a step of 25 kHz x 9. A discrete uniform distribution for frequency can be selected, e.g., between 410.0125 MHz and 411.9875 MHz having a step of 25 kHz. If there is no spatial correlation between the elements of the victim system and the elements of the interfering system then the simulation radius of the simulation is given by the formula: Rsimu Rsimu = radius of the area where interferers are uniformly spread nactive densitactive We have to consider 9 active interferers with a density of 5 terminals/km². Then the radius of simulation area results in: R = sqrt( 9 / (3.14 x 5) ) = 0.7569 km. The FM Base Station, which is the victim receiver, is supposed to be operating at 412.00625 MHz, that is the centre of the first channel, i.e. no guard interval is assumed. 1.3.4 Emission mask The total emission of the interfering transmitter consists of the wanted signal within the defined bandwidth corresponding to a frequency offset of ± 50 % of the emission bandwidth ItBW the out-of-band emission caused by the modulation within, e.g. ± 50...250 % of ItBW the spurious emission outside these ranges. This means the mask to be defined has to cover this whole range. This allows co-channel consideration as well. It should be noted that the TETRA MS unwanted emissions mask is not defined for frequency offsets below 12.5 kHz. Considering the channel spacing of 25 kHz and assuming 0 dBc/18 kHz in that range, then in the undefined range between 12.5 and 25 kHz, a linear interpolation between 0 and 60 dBc attenuation will be performed. It should also be taken into account that the reference bandwidth (18 kHz) used for the mask is identical to the bandwidth of the interfering system. 1.4 Probability of interference Based on the above assumptions the probability of interference (C/I criteria and unwanted emissions + blocking are taken into account) is about 1.1 % when the PC is “on” and about 8.1 % when the PC is “off”. 5 1.5 Step-by-step Exercise In this chapter, only the necessary inputs are mentioned. All other parameters are not required. Definition of the workspace, name: "TETRA-PMR" Antenna 1.5.1 Victim link/General Reference: PMR Reference: PMR-MS Description: Omni-directional Maximum gain: ..... dBi Frequency:......... MHz (channel spacing) Use wanted transmitter: yes 1.5.4 Wt-Vr path Coverage radius 1.5.2 Victim Receiver General Reference: PMR-BS C/I: ... dB required) (if only C/I, C/(N+I) and (I+N)/N are not C/(I+N) ... dB (C/(N+I) required only for selected Blocking-Mode) Noise floor: -131 dBm, constant(=Sensitivity – C/I) Blocking response: -23 dB, constant Blocking mode: Sensitivity Sensitivity: ..... dBm Bandwidth receiver: ...... kHz Antenna height: ... m, constant Antenna azimuth: 0...360 deg, uniform Antenna elevation: direction) 0 deg, constant (horizontal Computation of the cell radius: User-defined radius Fixed radius: ..... km Correlation: No (for Wt-Vr) Radio path length: (0...1)*cell radius) uniform polar (Distance Vr: Path Azimuth Vr: 0...360 deg, uniform Propagation model Model: Hata Median Loss: Yes Variation: Yes Environment: attenuation) RURAL (results in lowest path ...at Wt: OUTDOOR ...at Vr: OUTDOOR Propagation: ABOVE ROOF 30m BS-Antenna height) (caused by Antenna Reference: PMR-BS Description: Omni-directional Maximum gain: .... dBi 1.5.3 Interfering link 1/General Reference: TETRA-PMR-ILK1 Frequency: uniform ................................. MHz, Wanted Transmitter 1.5.6 General 1.5.5 Reference: PMR-MS Power: ...... dBm, constant Antenna height: 1.5 m, constant Antenna azimuth: 0...360 degrees, uniform Antenna elevation: 0 degrees, constant (horizontal direction) Interfering Transmitter General Reference: TETRA-MS Transmitting power: 30 dBm, constant Unwanted mask: Offset in MHz, power in dBc referred to Reference bandwidth -10.0000-100.0000 18.0000 -0.5010 -100.0000 18.0000 -0.5000 -80.0000 18.0000 -0.2510 -80.0000 18.0000 -0.2500 -75.0000 18.0000 -0.1000 -75.0000 18.0000 -0.0750 -66.0000 18.0000 -0.0500 -66.0000 18.0000 -0.0250 -60.0000 18.0000 -0.0125 0.0000 18.0000 0.0125 0.0000 18.0000 0.0250 -60.0000 18.0000 0.0500 -66.0000 18.0000 0.0750 -66.0000 18.0000 0.1000 -75.0000 18.0000 0.2500 -75.0000 18.0000 0.2510 -80.0000 18.0000 0.5000 -80.0000 18.0000 0.5010 -100.0000 18.0000 10.0000 -100.0000 18.0000 Unwanted emission floor: NO Transmitting bandwidth: (Bandwidth < channel) .... kHz Reference bandwidth: PC-Step: ... dB Minimal received power: .... dBm Maximum received power: .... dBm Antenna height: 1.5 m, constant Antenna azimuth: Antenna azimuth: 0...360 degrees, uniform Antenna elevation: 0 degrees, constant (horizontal direction) Reference: TETRA-BS Description: Omni-directional Maximum gain: … dBi 1.5.8 It-Vr path Relative location .... kHz YES 30 m, constant Antenna Power Control: Antenna height: Correlation mode: Uniform density Path Azimuth Vr: 0...360 degrees, uniform Number of active interferers: ..... Density of active interferers: .... users/km² Probability of transmission: 1 (transmits permanently) Activity per hour: 1 (transmits permanently) Protection distance: 0 km Propagation model 0...360 degrees, uniform Antenna elevation: 0 degrees, constant (horizontal direction) Model: .................... Median Loss: Yes Variation: Yes Environment: RURAL ...at Wt: OUTDOOR ...at Vr: OUTDOOR Propagation: ABOVE ROOF Power control (at receiver) 1.5.9 Computation of the radio coverage of the interferer Power control step: ..... dB Min threshold: ..... dBm Dynamic range: ..... dBm Antenna Reference: TETRA-MS Description: Omni-directional Maximum gain: 0 dBi 1.5.7 Wanted Receiver (only for power control) General Reference: TETRA-BS 7 It-Wr path (only for power control!) Correlation: No (for It-Wr) Mode: Traffic-limited network Density of interferers: .... users/km² Number of channels: .... Number of user per channel: 1 users/ch Frequency cluster: .... Path distance Factor: uniform polar (Distance: (0...1)*cell radius) Path Azimuth: 0...360 degrees, uniform Propagation model Model: Median Loss: Yes Variation: Yes Environment: RURAL ...at Wt: OUTDOOR ...at Vr: OUTDOOR Propagation: ABOVE ROOF 1.5.10 .................... Simulation control/Event generation Number of samples: 20000 (Default: 20000) 1.5.11 Test of the simulation Calculated radius Cell radius of the wanted system: ..interfering system 1: …. km ..simulation radius 1: …. km …. km Generated Signals PC “on” dRSS: mean: …. dBm, std: …. dB iRSSunwanted: mean: …. dBm, std: …. dB iRSSblocking: mean: …. dBm, std: …. dB PC “off” dRSS: mean: …. dBm, std: …. dB iRSSunwanted: mean: …. dBm, std: …. dB iRSSblocking: mean: …. dBm, std: …. dB 1.5.12 Interference calculation/ICE calculation Interference Criteria: C/I Compatibility mode: Yes (Probability of interference) Unwanted emissions: Yes Blocking" 1.5.13 Yes Result Probability: …. (= …. %)
