Chapter 4 -- Elevation
advertisement
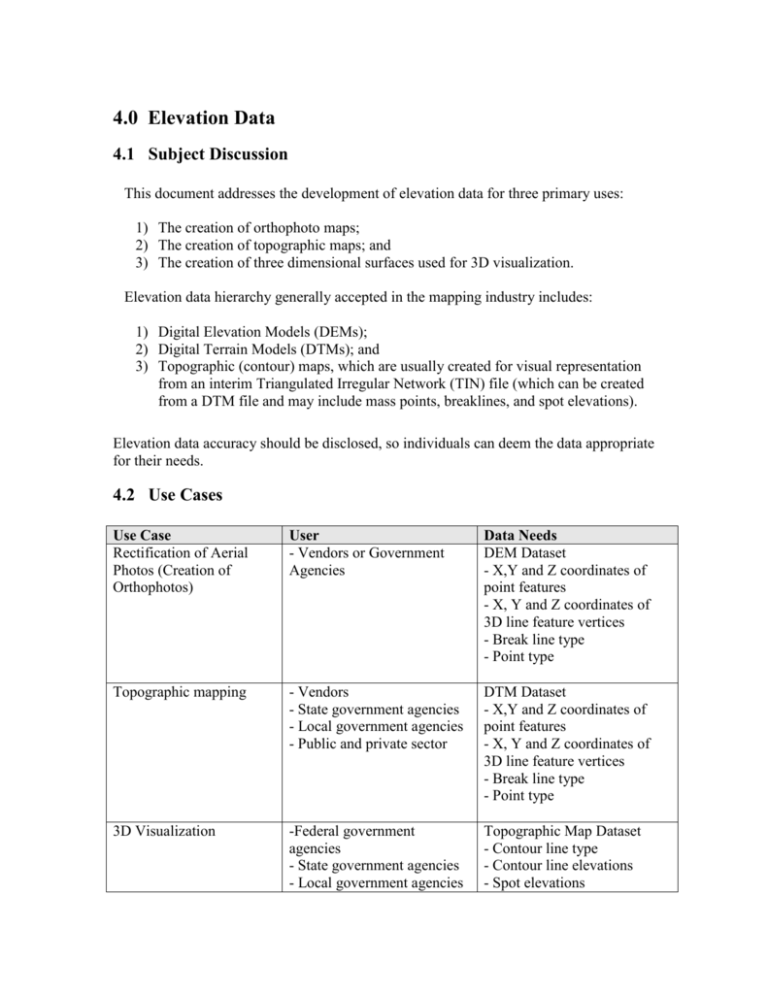
4.0 Elevation Data 4.1 Subject Discussion This document addresses the development of elevation data for three primary uses: 1) The creation of orthophoto maps; 2) The creation of topographic maps; and 3) The creation of three dimensional surfaces used for 3D visualization. Elevation data hierarchy generally accepted in the mapping industry includes: 1) Digital Elevation Models (DEMs); 2) Digital Terrain Models (DTMs); and 3) Topographic (contour) maps, which are usually created for visual representation from an interim Triangulated Irregular Network (TIN) file (which can be created from a DTM file and may include mass points, breaklines, and spot elevations). Elevation data accuracy should be disclosed, so individuals can deem the data appropriate for their needs. 4.2 Use Cases Use Case Rectification of Aerial Photos (Creation of Orthophotos) User - Vendors or Government Agencies Data Needs DEM Dataset - X,Y and Z coordinates of point features - X, Y and Z coordinates of 3D line feature vertices - Break line type - Point type Topographic mapping - Vendors - State government agencies - Local government agencies - Public and private sector DTM Dataset - X,Y and Z coordinates of point features - X, Y and Z coordinates of 3D line feature vertices - Break line type - Point type 3D Visualization -Federal government agencies - State government agencies - Local government agencies Topographic Map Dataset - Contour line type - Contour line elevations - Spot elevations Use Case 3D Surface analysis User - Planning organizations (public and private) - Developers -Environmental organizations - Planners - Tax assessors - Developers - Public and private utilities - Agricultural organizations - Public safety organizations Data Needs - Water elevations DEM Dataset - X,Y and Z coordinates of point features - X, Y and Z coordinates of 3D line feature vertices - Break line type - Point type DTM Dataset - X,Y and Z coordinates of point features - X, Y and Z coordinates of 3D line feature vertices - Break line type - Point type Topographic Map Dataset - Contour line type - Contour line elevations - Spot elevations - Water elevations 4.3 Recommendations 4.3.1 Digital Elevation Model (DEM) Data – General Requirements Elevation data is needed to rectify aerial imagery and to facilitate 3D visualizations. Typically, a DEM dataset is used for this purpose. A TIN dataset may be created as a step in the production process. 1) A DEM dataset should be delivered to the procuring agency along with completed aerial photographs in cases where the procuring agency needs to rectify the photos. This also allows the procuring agency to produce 3D visualizations. 2) Blind QA (quality assurance) ground control points should be used by the procuring agency to verify the integrity of the DEM data and the orthophoto products rectified using that data. 3) The data should be documented throughout the collection process and also during quality assurance. 4) If data are created by interpolation, they should also undergo quality assurance measures and those procedures should be documented as well. The quality assurance documentation should include the derivation of interpolated elevations from the DEM at quality assurance check point. These interpolated elevations can then be compared to field measured elevations. 4.3.2 DEM Data – Specifications 1) Depending upon the technology and methodologies used to create the DEM, breaklines may be collected to depict sudden changes in terrain. In such cases, breaklines should be collected to the extent necessary to ensure accurate representation of visible features on the orthophoto imagery produced using the DEM dataset. Breaklines may also be used to delineate exclusion areas (areas within which elevation data is not to be collected). Exclusion areas may include such features as bodies of water, quarries, prisons, other security areas, and stockpiles. 2) The elevated decks of bridges must be sufficiently delineated in the DEM dataset. The dataset must facilitate the orthorectification of bridges in their proper horizontal locations. 3) DEM data must have an accuracy level sufficient to produce orthophotos at scales required by the procuring agency. 4) Whether photogrammetric compilation, light detection and ranging (LiDAR), interferometric synthetic aperture radar (IFSAR), or other sensor technologies or methodologies are used, elevation data deliverables must meet the same vertical accuracy specifications. 5) Elevation data must be delivered as a continuous DEM surface with no mismatches, overlaps or gaps between models or tiles. 6) DEM data must meet orthophoto rectification and 3D visualization accuracy requirements and will not necessarily be considered adequate to be used for contour generation. A more rigorous DTM (Digital Terrain Model) must be provided if contours are to be interpolated or generated. 4.3.3 DEM Data Deliverables 1) DEM data may be delivered as a seamless project-wide dataset or may be partitioned into tiles encompassing geographic areas of 5,000’ by 5,000’ for 1” = 200’ scale mapping areas and 10,000’ by 10,000’ for 1” = 400’ scale mapping areas. The procuring agency may determine that another dataset partitioning strategy is more practical and may therefore request an alternative. 2) All delivery media must be labeled to reflect jurisdiction name, project, client, author, date, contents and other pertinent information required by the procuring agency. 3) An ASCII point file of XYZ coordinates with separate coding for mass points and breaklines will be delivered. ASCII file formats will contain five 4) 5) 6) 7) 8) aligned and space-delimited columns containing X-coordinate, Ycoordinate, Z-coordinate, breakline type and point code. Breakline types are: a) 1 = soft b) 2 = hard c) 3 = mass d) 4 = lake or exclusion area e) 5 = spot Point code attributes are: a) 1 = start of breakline b) 2 = point within breakline c) 3 = not used d) 4 = end of breakline e) 5 = mass point, not part of breakline An alternative ASCII delivery format may be defined and approved by the procuring agency prior to delivery. An FGDC-compliant metadata file must be delivered along with each ASCII DEM file. Interpolated quality assurance point coordinates should be reported in a file named Z_QA (area) (procuring agency) yymmdd.xls. The spreadsheet should have columns to store point ID, Map file, measured X-Y and interpolated Z coordinates. 4.3.4 DEM Elevation Data Acceptance Criteria 1) Vertical accuracy of data delivered shall be tested by comparing the interpolated elevations against known higher accuracy points such as blind field survey points or by the use of other methods that are equally effective in determining the accuracy of the dataset. 2) Vertical accuracy requirements must be met or exceeded. 3) A visual inspection must be made to ensure that there are no overlaps, no gaps or surface irregularities. 4) Written certification must be provided by the data producer stating that orthophoto image products created using the delivered DEM dataset will meet or exceed required accuracy specifications. 4.3.5 Digital Terrain Model (DTM) Data – General Requirements Elevation data is needed to generate topographic mapping. Typically, a DTM dataset is used for this purpose. A TIN dataset may be created as a step in the production process. 1) A DTM dataset should be delivered to the procuring agency accompanied by the completed topographic mapping data in cases wherein the procuring agency has requested topographic mapping. This facilitates future usage of the DTM dataset for topographic mapping, aerial photo rectification, and 3D visualization by the procuring agency. 2) Randomly placed blind QA (quality assurance) ground control points should be used by the procuring agency to verify the integrity of the DTM data and the topographic mapping products that are created from it. 3) The producer of the data should document the process and quality assurance used to generate the DEM data for the project. 4) The quality assurance process should include the derivation of interpolated elevations from the DTM at quality assurance check point locations. These interpolated elevations can then be compared to field measured elevations. 4.3.6 DTM Data - Specifications 1) Depending upon the technology and methodologies used to create the DTM, breaklines may be collected to depict sudden changes in terrain. In such cases, breaklines should be collected to the extent necessary to ensure accurate representation of the terrain on topographic maps produced using the DTM dataset and to ensure accurate representation of visible features on orthophoto imagery that may be produced using the DTM dataset. Breaklines may also be used to delineate exclusion areas (areas within which elevation data is not to be collected). Exclusion areas may include such features as bodies of water, quarries stockpiles, and Prisons. 2) The elevated decks of bridges must be sufficiently delineated in the DTM dataset. The data must be sufficient to facilitate the orthorectification of bridges in their proper horizontal locations on orthophotos that may be produced using the DTM dataset. 3) DTM data must meet the horizontal accuracy requirements for topographic contour mapping. 4) Elevation data should be delivered as a continuous DTM surface with no mismatches, overlaps or gaps between models or tiles. 5) DTM datasets must be created for contour generation. A less rigorous DEM dataset can be provided if contours are not to be generated. A DEM can support orthophoto rectification and less rigorous 3D visualization requirements. 4.3.7 DTM Data Deliverables 1) DTM data may be delivered as a seamless project-wide dataset or may be partitioned into tiles encompassing geographic areas of 5,000’ by 5,000’ for 1” = 200’ scale mapping areas and 10,000’ by 10,000’ for 1” = 400’ scale mapping areas. The procuring agency may determine that another dataset partitioning strategy is more practical and may therefore request and alternative. 2) All delivery media must be labeled to reflect jurisdiction name, project, client, author, date, contents and other pertinent information required by the procuring agency. 3) An ASCII point file of XYZ coordinates with separate coding for mass 4) 5) 6) 7) points and breaklines must be delivered. ASCII file formats will contain five aligned and space-delimited columns containing X-coordinate, Ycoordinate, Z-coordinate, breakline type and point code. Breakline types are: a) 1 = soft b) 2 = hard c) 3 = mass d) 4 = lake or exclusion area e) 5 = spot Point code attributes are: a) 1 = start of breakline b) 2 = point within breakline c) 3 = not used d) 4 = end of breakline e) 5 = mass point, not part of breakline An alternative ASCII delivery format may be defined and approved by the procuring agency prior to delivery. Interpolated quality assurance point coordinates shall be reported in a file named Z_QA (area) (procuring agency) yymmdd.xls. The spreadsheet should have columns to store point ID, Map file, measured X-Y and interpolated Z coordinates. 4.3.8 DTM Elevation Data Acceptance Criteria 1) Vertical accuracy of data delivered shall be tested by comparing the interpolated elevations against known higher accuracy points such as blind field survey points or by the use of other methods that are equally effective in determining the accuracy of the dataset. 2) Vertical accuracy requirements must be met or exceeded. 3) A visual inspection must be made to ensure that there are no overlaps, gaps or surface irregularities. 4) Written certification must be provided by the data producer stating that topographic mapping products created using the delivered DTM dataset will meet or exceed required accuracy specifications. 4.3.9 Topographic Contour Mapping – General Requirements Contours must be created to portray the shape of terrain within the accuracy standards specified. Contours must reflect the crown or cross slope of all paved areas and must truly depict all drainage ways. Contours must be “topologically clean,” meaning that in general contours cannot cross each other or arbitrarily end in space. Contours may only cross each other at overpasses as explained below and shall end only as they extend outside the project area limits. Contour lines are usually shown at a vertical interval of 2 feet on 1” = 100’ scale topographic maps, 5 feet on 1” = 200’ scale topographic maps and 10 feet on 1” = 400’ topographic maps. Every fifth contour line is an index contour, graphically indicated by a line heavier than that used for the intermediate contours. Index contours are usually labeled with elevation annotation inside a break in the contour line at a frequency that is easy to interpret and aesthetically pleasing. All contour line symbols are to be solid and unbroken except where the lines pass through dense ground cover, in which case, dashed line symbols are to be used. In areas where vegetation prohibits accurate plotting of contours, the contour line elevations will be interpolated as accurately as possible from spot elevations collected where the ground is visible. Coding should be applied to contour lines to facilitate display and plotting of the contour lines as described above. DTM elevation data is typically required to generate contour information. If used in the contour generation process, a DTM dataset should be delivered to the procuring agency along with the contour data. 1) Contours may be generated from DTM data, may be photogrammetrically “string collected”, or may be collected in the field with survey instruments. 2) The process used to collect and perform quality assurance on the contour data for a project must be documented. 3) The quality assurance process should include the derivation of interpolated elevations from the topographic mapping dataset at quality assurance check point locations. These interpolated elevations can then be compared to field measured elevations. 4.3.10 Topographic Contour Mapping - Specifications 1) Contour line features should be continuous, uninterrupted lines with no gaps or dangling endpoints. In the context of the discussion herein, any reference to “breaks” in contour lines means that a segment of line should be placed in the area to be “broken”. This segment should be snapped cleanly to the segments of the contour line outside of the area to be broken. The broken area segment must be coded to facilitate independent control of the display and plotting of the line segment. For example, a contour line may pass through a building. For cases in which planimetric data is to be used along with topographic data, a segment of contour line within the building footprint should be coded in such a way that its display and plotting can be controlled independently from the segments of the contour that do not fall within the building footprint. Such contour line segments will be referred to as hidden segments. 2) For cases in which planimetric data is to be used along with topographic data, contours should be broken for man-made structures that do not conform to the terrain. Examples of such structures include buildings, retaining walls, and bridges. Contours should join cleanly to exclusion area boundaries or planimetric feature line segments that surround these features. 3) Contours should be broken for active quarries, areas under construction, debris piles, or storage piles. Contours should join cleanly to exclusion area boundaries or planimetric feature line segments that surround these features. 4) Contours should turn back on single-line streams and should cross doubleline streams as a straight line from shore to shore. 5) A depression contour is a contour that closes within the mapping limits (or obviously closes outside the mapping limits) such that the area enclosed by the contour is lower than the contour elevation. Depressions often occur around catch basins. If the contour turns back on a stream or ditch or into a culvert or headwall, it is not a depression contour unless it closes on the other side of the culvert or headwall or under the road. 6) Every fifth contour shall be annotated with its elevation and must have coding that facilitates its display using a thicker line weight than intermediate contours. Index contours should not be broken for spot elevations. 7) Contours that are obstructed by dense vegetation must be coded as obscured contours. 8) Annotation indicating the elevation of an index contour must be placed on the index contour in such a manner that the bottom of the number corresponds to the ground that is lower than the index elevation. 9) Spot elevations must be used in conjunction with contour lines to accurately portray the terrain. Spot elevations should be placed at the following points: a) All road and/or railroad intersections. b) At each end of bridges on centerline of road. c) At centerline of roads above culverts. d) At the highest point of closed contour tops. e) At the lowest point of closed depressions, significant saddles, and quarries. At points visible through dense vegetation in obscured areas. f) Any place in which there is more than 2 inches between contours and/or spot elevations at the map presentation scale. 10) Water elevation points and their accompanying elevation annotation should be placed at or near the centers of water bodies. Water elevations should not be shown along streams. 11) Coding must be applied to contour lines to differentiate between the following contour features: a) Index contour b) Intermediate contour c) Depression index contour d) Depression intermediate contour e) Obscured index contour f) Obscured intermediate contour g) Obscured depression index contour h) Obscured depression intermediate contour i) Index contour hidden segment j) Intermediate contour hidden segment k) Depression index contour hidden segment l) Depression intermediate contour hidden segment m) Obscured index contour hidden segment n) Obscured intermediate contour hidden segment o) Obscured depression index contour hidden segment p) Obscured depression intermediate contour hidden segment 12) Whether photogrammetric compilation, field survey methods, light detection and ranging (LiDAR), interferometric synthetic aperture radar (IFSAR), or other sensor technologies or methodologies are used, elevation data deliverables shall meet the same vertical accuracy specifications. 4.3.11 Contour Data Deliverables 1) Contour data may be delivered as a seamless project-wide dataset or may be partitioned into tiles encompassing geographic areas of 5,000’ by 5,000’ for 1” = 200’ scale mapping areas and 10,000’ by 10,000’ for 1” = 400’ scale mapping areas. The procuring agency may agree that another dataset partitioning strategy is more practical and may therefore request and alternative. 2) All media shall be labeled to reflect jurisdiction name, project, client, author, date, contents, and other pertinent information. 3) An alternative delivery format may be defined and approved by the procuring agency prior to delivery. 4) Written certification must be provided by the data producer stating that topographic mapping products meet or exceed required accuracy specifications. 4.4 Responsibilities Responsibilities for creation and maintenance of layer features and attributes must be defined to suit the procuring agency. 4.5 Definitions Mass Points are point data features that represent locations on the ground in three dimensions. A mass point is defined in terms of an x, y, and z coordinate, typically represented as an easting, a northing, and an elevation. Mass points are commonly used as components of digital elevation models and digital terrain models to represent terrain. Mass points are generally created in evenly spaced grid patterns, but may also be placed randomly depending on the method of creation and the characteristics of the terrain being defined. Spot elevations are point data features that represent locations on the ground in three dimensions. A spot elevation is defined in terms of an x, y, and z coordinate, typically represented as an easting, a northing and an elevation. Spot elevations are commonly used as components of digital terrain models to represent terrain. Spot elevations are typically created individually and placed at specific locations to depict terrain features that may not be accurately represented by mass points. Spot elevations are commonly created using photogrammetric methods from aerial photography. Spot elevations are placed at hilltops, saddles, bottoms of depressions, intersections of principal streets and highways and ends of bridges. Spot elevations can also be derived by other methods, including field surveys. Breaklines are line data features that represent sudden changes in terrain, usually associated with linear ground features such as retaining walls, road edges, and ridgelines. Breaklines consist of vertices that are defined in terms of x, y, and z coordinates, typically represented as eastings, northings, and elevations. Breaklines are commonly used as components of digital elevation models and digital terrain models to represent terrain. A digital elevation model (DEM) is a dataset that represents the terrain of an area at a level of accuracy suitable for the generation of orthophoto imagery. A DEM may consist of mass points and/or breaklines that define the elevation of a surface. Mass point and breakline accuracy, spacing and density requirements are determined by the accuracy requirements of the orthophotos that are generated using the DEM data. In the context of this document, the DEM will be considered to be the minimum terrain data standard for the generation of horizontally accurate Digital Orthophoto Imagery. The term “orthograde” accuracy is often used to describe the accuracy of a DEM in contrast to terrain datasets used for other purposes. A digital terrain model (DTM) is similar to a DEM, but typically incorporates mass points, breaklines and spot elevations at different spacing and density so as to more accurately depict the character of the terrain. DTM data is typically more robust than DEM data, and is typically based on more accurate and more robust ground control than that required for the generation of a DEM. In the context of this document, the DTM will be considered to be the minimum standard for the generation of topographic contours. A triangulated irregular network (TIN) is a dataset consisting of adjacent, nonoverlapping triangles that represent planar facets that are sloped in three-dimensional space. The triangles are formed from lines constructed between mass points, spot elevations and breaklines. Each triangle side has a uniform slope. A contour line portrays a group of points of equal elevation on a land surface. Contours, along with spot elevations, have long been accepted as the visual representation of elevation change for the technical and layperson. Contour lines are typically generated using digital technology where the contour lines are interpolated from sources such as DTM datasets or TIN datasets. Contour lines can also be “string collected” photogrammetrically using stereo plotting instruments. They can also be created using survey instruments in the field. 4.6 Data Exchange Specifications The goal of the exchange standard is to specify the essential file format and attribute information required to facilitate data exchange. Even though ASCII formats are described in the preceding text, more commonly used and practical formats, preferred for data exchange between GIS users, are described below. 4.6.1 Projection, Coordinate Systems and Units of Measurement The preferred exchange projection is Pennsylvania State Plane, NAD 83, NAVD 88, North or South Zone (as appropriate for the area to be delivered). The preferred unit is the International Survey Foot. Given the amount of pre-existing data that may be exchanged, it is understood that other projected coordinate systems with differing datum specifications may be exchanged. It will be necessary in all cases for the originating organization to provide information regarding coordinate system, datum units of measurement for all data sets. 4.6.2 File Formats – DEM and DTM data File formats for DEM and DTM data will vary based on the software and methodology used to create the data and on the file format requirements that were in place in the procuring organization at the time of delivery. The preferred exchange format for DEM and DTM data will be a 3D Shapefile, based on Environmental Systems Research Institute’s published Shapefile Standard. This file format lends itself well to this purpose because it facilitates the transfer of 3D geometry for line features necessary for the representation of breaklines, which require the storage of elevation information for each end point and intermediate vertex. File formats with similar capabilities include AutoCad dwg and dxf, and Microstation 4.6.3 DEM/DTM File File Name: DEMXXXXX.shp* DTMXXXXX.shp* * where XXXXX is replaced by a county FIPS code File Type: ESRI 3D Shape File Note: The file must be a 3D shape file as opposed to a standard (2D) Shape File. Content: 3D point features and 3D line (breakline) features depicting mass elevation points, spot elevation points and hard and soft breaklines. Topology: Point and Line Point Attribute Table: Field Name Data Width & Type FEATURE_CODE 4 Integer ELEVATION 8 Double Precision Description Elevation point type Elevation Values 1= Mass Point 2=Spot Elevation Positive or negative doubleprecision values Description Line type Values 1= Soft Breakline 2=Hard Breakline 4=Lake or exclusion area Line Attribute Table: Field Name Data Width & Type FEATURE_CODE 4 Integer 4.6.4 File Formats – Contour data When considering the exchange of contour data, the file format options become less restrictive because it is not necessary to store 3D geometry for line features in the same manner required to represent breaklines. Contour line features (the endpoints and all intermediate line segments and vertices) require only a single elevation attribute attached to each segment. This makes it possible to use the ESRI standard or 2D Shapefile Format for the exchange of contour data. The preferred exchange format for contour data will therefore be a standard 2D Shapefile, based on Environmental Systems Research Institute’s published Shapefile Standard. 4.6.5 Contour File File Name: TOPOXXXXX.shp* *where XXXXX is replaced by a county FIPS code File Type: ESRI 2D Shape File Content: Point features representing spot elevations and line features representing contour lines. Topology: Point and Line 4.7 References 1. Falkner, Edgar, 1994. Aerial Mapping: Methods and Applications. Boca Raton, FL: Lewis Publishers. 2. Lillesand, Thomas, M., and Kiefer, Ralph W., 2000. Remote Sensing and Image Interpretation, 4th Edition. New York: John Wiley & Sons. 3. Wolf, Paul R. and Dewitt, Bon A., 2000. Elements of Photogrammetry, with Applications in GIS, 3rd Edition. Madison, WI: McGraw-Hill. 4. Greve, Clifford (Ed.), 1996. Digital Photogrammetry: An Addendum to the Manual of Photogrammetry. Bethesda, MD: American Society for Photogrammetry and Remote Sensing. 5. Maune, David F. (Ed.), 2001. Digital Elevation Model Technologies and Applications: The DEM Users Manual. Bethesda, MD: American Society for Photogrammetry and Remote Sensing. 6. Slama, Chester, (Ed.), 1980. Manual of Photogrammetry, 4th Ed., Falls Church, VA: American Society of Photogrammetry. 7. American Congress on Surveying and Mapping, American Society for Photogrammetry and Remote Sensing, and American Society for Civil Engineers, 1994. The Glossary of the Mapping Sciences. Bethesda, MD & New York: Author. 8. North Carolina Land Records Management Program, 1987. Technical Specifications for Base, Cadastral and Digital Mapping. Raleigh, NC: Author. 9. American Society of Civil Engineers, 1996. Photogrammetric Mapping, (Technical Engineering and Design Guides as Adapted from the US Army Corps of Engineers, No. 14. New York: Author.

