CHAPTER 13: SIMPLE LINEAR REGRESSION AND CORRELATION
advertisement
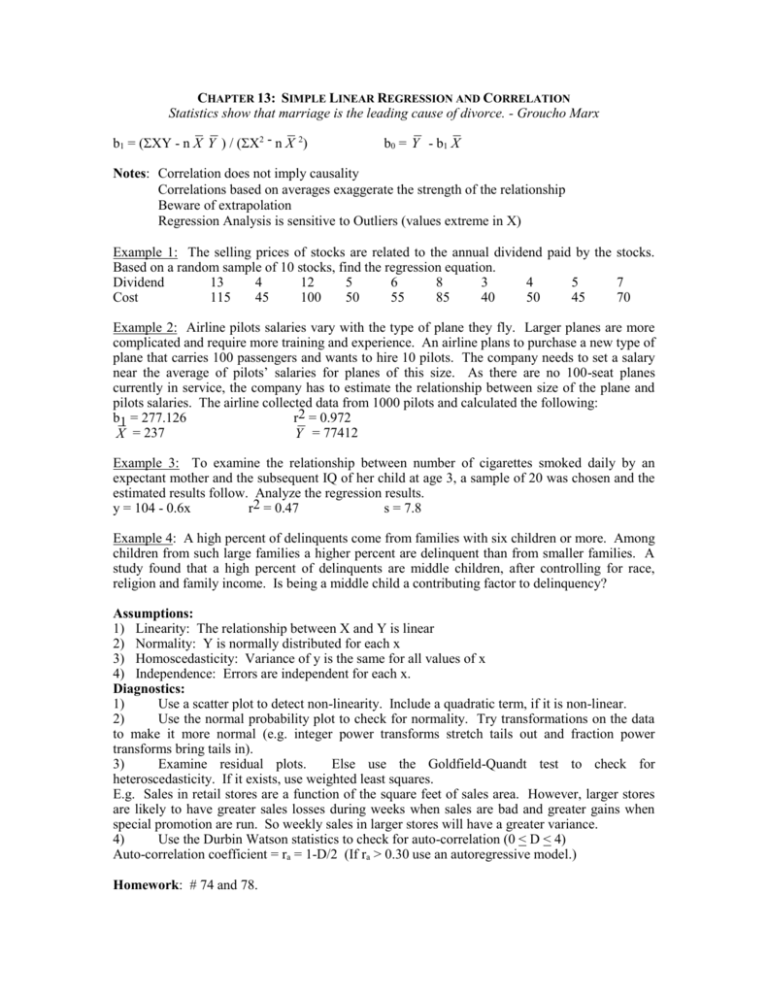
CHAPTER 13: SIMPLE LINEAR REGRESSION AND CORRELATION Statistics show that marriage is the leading cause of divorce. - Groucho Marx b1 = (XY - n X Y ) / (X2 - n X 2) b0 = Y - b1 X Notes: Correlation does not imply causality Correlations based on averages exaggerate the strength of the relationship Beware of extrapolation Regression Analysis is sensitive to Outliers (values extreme in X) Example 1: The selling prices of stocks are related to the annual dividend paid by the stocks. Based on a random sample of 10 stocks, find the regression equation. Dividend 13 4 12 5 6 8 3 4 5 7 Cost 115 45 100 50 55 85 40 50 45 70 Example 2: Airline pilots salaries vary with the type of plane they fly. Larger planes are more complicated and require more training and experience. An airline plans to purchase a new type of plane that carries 100 passengers and wants to hire 10 pilots. The company needs to set a salary near the average of pilots’ salaries for planes of this size. As there are no 100-seat planes currently in service, the company has to estimate the relationship between size of the plane and pilots salaries. The airline collected data from 1000 pilots and calculated the following: b1 = 277.126 r2 = 0.972 X = 237 Y = 77412 Example 3: To examine the relationship between number of cigarettes smoked daily by an expectant mother and the subsequent IQ of her child at age 3, a sample of 20 was chosen and the estimated results follow. Analyze the regression results. y = 104 - 0.6x r2 = 0.47 s = 7.8 Example 4: A high percent of delinquents come from families with six children or more. Among children from such large families a higher percent are delinquent than from smaller families. A study found that a high percent of delinquents are middle children, after controlling for race, religion and family income. Is being a middle child a contributing factor to delinquency? Assumptions: 1) Linearity: The relationship between X and Y is linear 2) Normality: Y is normally distributed for each x 3) Homoscedasticity: Variance of y is the same for all values of x 4) Independence: Errors are independent for each x. Diagnostics: 1) Use a scatter plot to detect non-linearity. Include a quadratic term, if it is non-linear. 2) Use the normal probability plot to check for normality. Try transformations on the data to make it more normal (e.g. integer power transforms stretch tails out and fraction power transforms bring tails in). 3) Examine residual plots. Else use the Goldfield-Quandt test to check for heteroscedasticity. If it exists, use weighted least squares. E.g. Sales in retail stores are a function of the square feet of sales area. However, larger stores are likely to have greater sales losses during weeks when sales are bad and greater gains when special promotion are run. So weekly sales in larger stores will have a greater variance. 4) Use the Durbin Watson statistics to check for auto-correlation (0 < D < 4) Auto-correlation coefficient = ra = 1-D/2 (If ra > 0.30 use an autoregressive model.) Homework: # 74 and 78.
