Day 1, Lesson 1 – Right Triangle Trig Review
advertisement
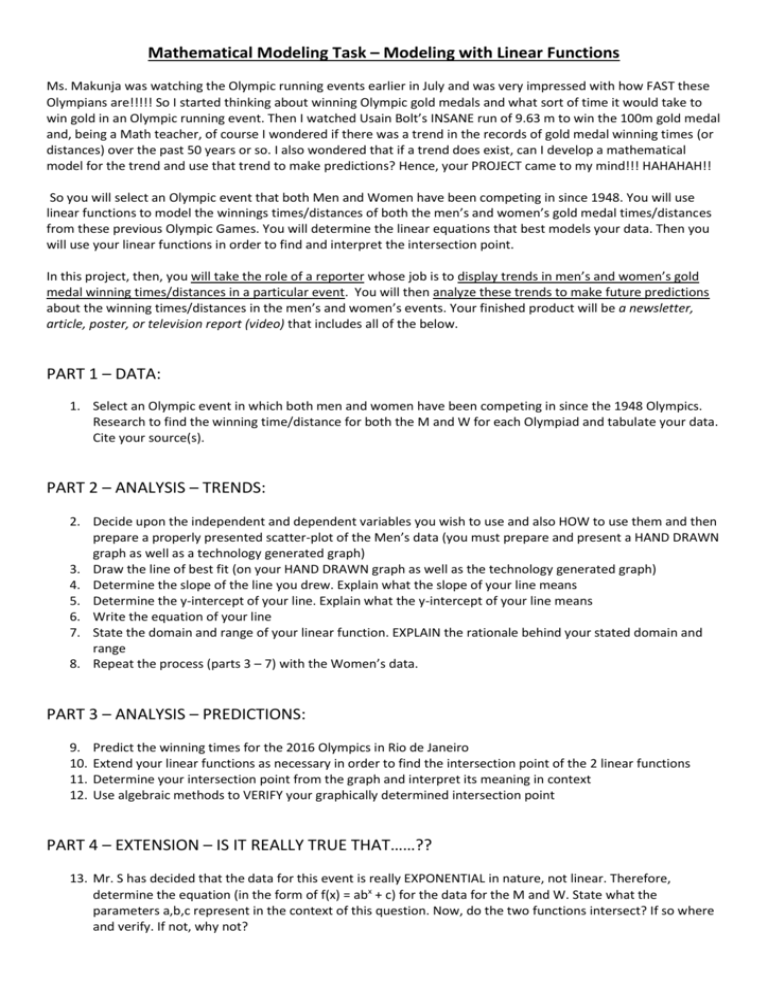
Mathematical Modeling Task – Modeling with Linear Functions Ms. Makunja was watching the Olympic running events earlier in July and was very impressed with how FAST these Olympians are!!!!! So I started thinking about winning Olympic gold medals and what sort of time it would take to win gold in an Olympic running event. Then I watched Usain Bolt’s INSANE run of 9.63 m to win the 100m gold medal and, being a Math teacher, of course I wondered if there was a trend in the records of gold medal winning times (or distances) over the past 50 years or so. I also wondered that if a trend does exist, can I develop a mathematical model for the trend and use that trend to make predictions? Hence, your PROJECT came to my mind!!! HAHAHAH!! So you will select an Olympic event that both Men and Women have been competing in since 1948. You will use linear functions to model the winnings times/distances of both the men’s and women’s gold medal times/distances from these previous Olympic Games. You will determine the linear equations that best models your data. Then you will use your linear functions in order to find and interpret the intersection point. In this project, then, you will take the role of a reporter whose job is to display trends in men’s and women’s gold medal winning times/distances in a particular event. You will then analyze these trends to make future predictions about the winning times/distances in the men’s and women’s events. Your finished product will be a newsletter, article, poster, or television report (video) that includes all of the below. PART 1 – DATA: 1. Select an Olympic event in which both men and women have been competing in since the 1948 Olympics. Research to find the winning time/distance for both the M and W for each Olympiad and tabulate your data. Cite your source(s). PART 2 – ANALYSIS – TRENDS: 2. Decide upon the independent and dependent variables you wish to use and also HOW to use them and then prepare a properly presented scatter-plot of the Men’s data (you must prepare and present a HAND DRAWN graph as well as a technology generated graph) 3. Draw the line of best fit (on your HAND DRAWN graph as well as the technology generated graph) 4. Determine the slope of the line you drew. Explain what the slope of your line means 5. Determine the y-intercept of your line. Explain what the y-intercept of your line means 6. Write the equation of your line 7. State the domain and range of your linear function. EXPLAIN the rationale behind your stated domain and range 8. Repeat the process (parts 3 – 7) with the Women’s data. PART 3 – ANALYSIS – PREDICTIONS: 9. 10. 11. 12. Predict the winning times for the 2016 Olympics in Rio de Janeiro Extend your linear functions as necessary in order to find the intersection point of the 2 linear functions Determine your intersection point from the graph and interpret its meaning in context Use algebraic methods to VERIFY your graphically determined intersection point PART 4 – EXTENSION – IS IT REALLY TRUE THAT……?? 13. Mr. S has decided that the data for this event is really EXPONENTIAL in nature, not linear. Therefore, determine the equation (in the form of f(x) = abx + c) for the data for the M and W. State what the parameters a,b,c represent in the context of this question. Now, do the two functions intersect? If so where and verify. If not, why not?

