Medium term overview maths

Mathematics sample medium-term plan: Year 7 Road Safety Materials
Autumn term
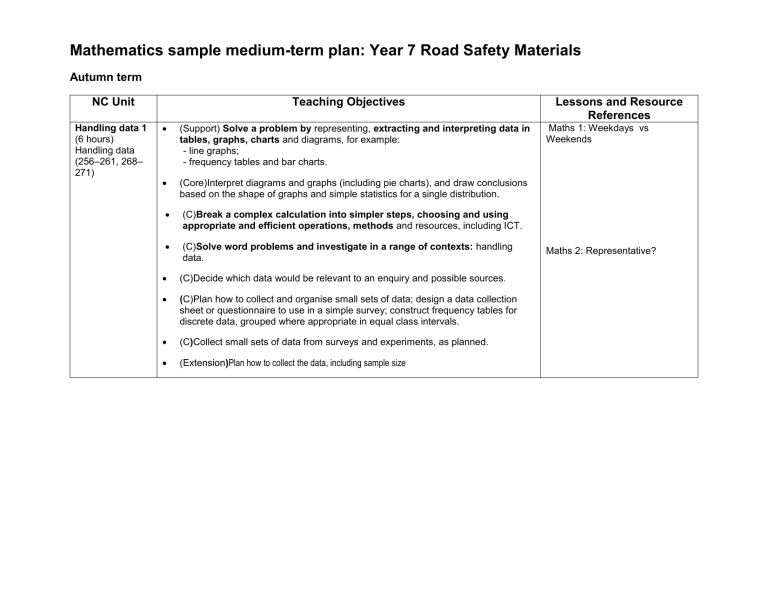
NC Unit Teaching Objectives
Handling data 1
(6 hours)
Handling data
(256 –261, 268–
271)
(Support) Solve a problem by representing, extracting and interpreting data in tables, graphs, charts and diagrams, for example:
- line graphs;
- frequency tables and bar charts.
(Core)Interpret diagrams and graphs (including pie charts), and draw conclusions based on the shape of graphs and simple statistics for a single distribution.
(C) Break a complex calculation into simpler steps, choosing and using appropriate and efficient operations, methods and resources, including ICT.
(C) Solve word problems and investigate in a range of contexts: handling data.
(C)Decide which data would be relevant to an enquiry and possible sources.
( C)Plan how to collect and organise small sets of data; design a data collection sheet or questionnaire to use in a simple survey; construct frequency tables for discrete data, grouped where appropriate in equal class intervals.
(C ) Collect small sets of data from surveys and experiments, as planned.
(Extension ) Plan how to collect the data, including sample size
Lessons and Resource
References
Maths 1: Weekdays vs
Weekends
Maths 2: Representative?
Spring term
NC Unit
Handling data 2
(5 hours)
Handling data
(248 –255, 262–
265, 268 –271)
Number and measures 3
(8 hours)
Measures
(228 –231)
Solving problems
(28 –31)
Algebra 3
(6 hours)
Integers, powers and roots
(52 –59)
Sequences, functions and graphs
(148 –167)
Teaching Objectives
(S)Solve a problem by representing, extracting and interpreting data in tables, graphs, charts and diagrams.
(C )Construct, on paper and using ICT, graphs and diagrams to represent data, including- bar, -line graphs; use ICT to generate pie charts.
(C)Interpret diagrams and graphs (including pie charts), and draw conclusions based on the shape of graphs and simple statistics for a single distribution.
(E)Construct on paper and using ICT: - pie charts for categorical data
(C)Decide which data would be relevant to an enquiry and possible sources.
(C)Plan how to collect and organise small sets of data; design a data collection sheet or questionnaire to use in a simple survey
(C)Collect small sets of data from surveys and experiments, as planned.
(E)Plan how to collect the data, including sample size; construct frequency tables with given equal class intervals for sets of continuous data.
(S)Develop calculator skills and use a calculator effectively.
(S)Use, read and write standard metric units of length and time.
(S)Use all four operations to solve word problems, including time.
(C)Make and justify estimates and approximations of calculations.
(C)Check a result by considering whether it is of the right order of magnitude and by working the problem backwards.
(C)Use names and abbreviations of units of measurement to measure, estimate, calculate and solve problems in everyday contexts involving length, area, mass, capacity and time;
(C)Present and interpret solutions in the context of the original problem; explain and justify methods and conclusions, orally and in writing.
(E) Know rough metric equivalents of imperial measures in daily use.
(E)Give solutions to an appropriate degree of accuracy in the context of the problem.
(S)Recognise and extend number sequences.
(C)Generate sequences from practical contexts and describe the general term in simple cases.
(C)Express simple functions in words, then using symbols; represent them in mappings.
(E)Generate terms of a linear sequence using term-to-term and position-to-term definitions, on paper and using a spreadsheet or graphical calculator.
(E)Begin to use linear expressions to describe the n th term of an arithmetic sequence.
(E)Express simple functions in symbols; represent mappings expressed algebraically.
Lessons and resource
References
Maths 1: Weekdays vs Weekends
(or alternative data offered)
Maths 3: Child & Adult Casualties
Maths 4: Stopping Distances -
Reaction times
Maths 2: Representative?
Maths 5: Public Transport
Maths 6: Environmental Costs
Maths 4: Stopping Distances
Summer term
NC Unit
Handling data 3
(8 hours)
Handling data
(250 –273)
Algebra 5
(8 hours)
Sequences, functions and graphs
(154 –177)
Teaching Objectives
(S)Solve a problem by representing, extracting and interpreting data in tables, graphs and charts.
(C)Decide which data would be relevant to an enquiry and possible sources.
(C)Plan how to collect and organise small sets of data; design a data collection sheet or questionnaire to use in a simple survey; construct frequency tables for discrete data, grouped where appropriate in equal class intervals.
(C)Construct, on paper and using ICT, graphs and diagrams to represent data, including: - bar-line graphs; - frequency diagrams for grouped discrete data; use
ICT to generate pie charts.
(E) Construct on paper and using ICT: - pie charts for categorical data; - simple line graphs for time series.
(C)Interpret diagrams and graphs (including pie charts), and draw conclusions based on the shape of graphs and simple statistics for a single distribution.
(E)Interpret tables, graphs and diagrams for both discrete and continuous data.
(C)Write a short report of a statistical enquiry and illustrate with appropriate diagrams, graphs and charts, using ICT as appropriate; justify the choice of what is presented.
Lessons and resource
References
Maths 4: Stopping Distances
Maths 2: Representative?
Revisit and evaluate impact
Maths 3: Child & Adult Casualties
Maths 1: Weekdays vs Weekends
(or alternative data offered)
Maths 2: Representative?
Revisit and evaluate impact
Maths 4: Stopping Distances
(C)Use simple formulae from mathematics and other subjects, substitute positive integers in simple linear expressions and formulae and, in simple cases, derive a formula.
(C)Generate sequences from practical contexts and describe the general term in simple cases.
(C)Express simple functions (in words, then) using symbols; represent them in mappings.
(E)Begin to use linear expressions to describe the n th term of an arithmetic sequence.


