File
advertisement
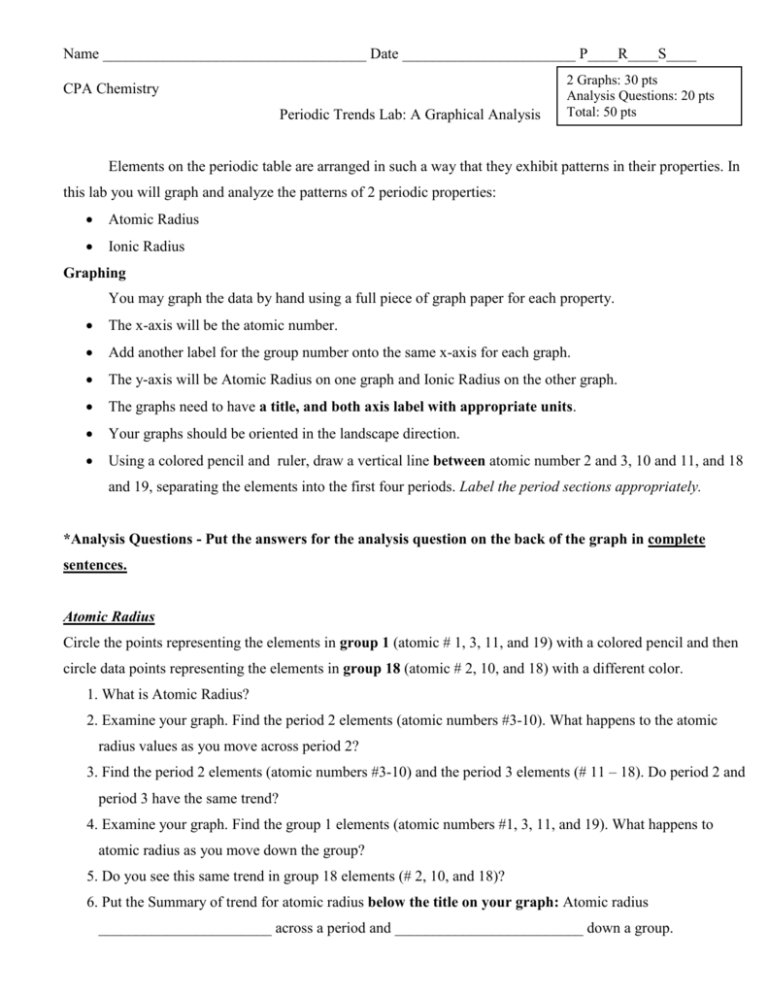
Name ___________________________________ Date _______________________ P____R____S____ CPA Chemistry Periodic Trends Lab: A Graphical Analysis 2 Graphs: 30 pts Analysis Questions: 20 pts Total: 50 pts Elements on the periodic table are arranged in such a way that they exhibit patterns in their properties. In this lab you will graph and analyze the patterns of 2 periodic properties: Atomic Radius Ionic Radius Graphing You may graph the data by hand using a full piece of graph paper for each property. The x-axis will be the atomic number. Add another label for the group number onto the same x-axis for each graph. The y-axis will be Atomic Radius on one graph and Ionic Radius on the other graph. The graphs need to have a title, and both axis label with appropriate units. Your graphs should be oriented in the landscape direction. Using a colored pencil and ruler, draw a vertical line between atomic number 2 and 3, 10 and 11, and 18 and 19, separating the elements into the first four periods. Label the period sections appropriately. *Analysis Questions - Put the answers for the analysis question on the back of the graph in complete sentences. Atomic Radius Circle the points representing the elements in group 1 (atomic # 1, 3, 11, and 19) with a colored pencil and then circle data points representing the elements in group 18 (atomic # 2, 10, and 18) with a different color. 1. What is Atomic Radius? 2. Examine your graph. Find the period 2 elements (atomic numbers #3-10). What happens to the atomic radius values as you move across period 2? 3. Find the period 2 elements (atomic numbers #3-10) and the period 3 elements (# 11 – 18). Do period 2 and period 3 have the same trend? 4. Examine your graph. Find the group 1 elements (atomic numbers #1, 3, 11, and 19). What happens to atomic radius as you move down the group? 5. Do you see this same trend in group 18 elements (# 2, 10, and 18)? 6. Put the Summary of trend for atomic radius below the title on your graph: Atomic radius _______________________ across a period and _________________________ down a group. Ionic Radius Put a “+” over the points representing the cations in period 1 (atomic # 3-6), period 2 (11-14), period 3 (19-20) with a colored pencil. Put a “-” over the other points representing the anions. Circle the points representing the elements in group 1 (atomic #3, 11, and 19) with a colored pencil and then circle data points representing the elements in group 17 (atomic # 9 and17) with a different color. 1. How does an atom become a cation and an anion? 2. What happens to the ionic radius values of the cations (+) as you move across period 2? 3. What happens to the ionic radius values of the anions (-) as you move across period 2? 4. Do period 2 and period 3 have the same trend for both the cations and anions? 5. Examine your graph. Find atomic numbers #3, 11, and 19 that correspond to the elements in Group 1. What happens to ionic radius as you move down the group 1 elements? 6. Do you see this same trend in group 17 elements (# 9 and 17)? 7. At what group # does the ionic radius suddenly increase dramatically from the lowest to the highest? Why? 8. Why is there no ionic radius at the atomic number 2, 10, and 18? 9. Put the Summary of trend for ionic radius below the title on your graph: Ionic radius _______________________ across a period and _________________________ down a group Element Symbol Atomic # Atomic Radius (pm) Ionic Radius* (pm) H 1 53 0.00006 He 2 31 Li 3 167 60 Be 4 112 31 B 5 87 20 C 6 67 15 N 7 56 171 O 8 48 140 F 9 42 136 Ne 10 38 Na 11 190 95 Mg 12 145 65 Al 13 118 50 Si 14 111 41 P 15 98 212 S 16 88 184 Cl 17 79 181 Ar 18 71 K 19 243 133 Ca 20 194 99 *A Blank does NOT mean Zero. You will have some breaks in your graph. Your lines will stop and then start again after the missing points.

