engineering_lightcurves_lab_data
advertisement
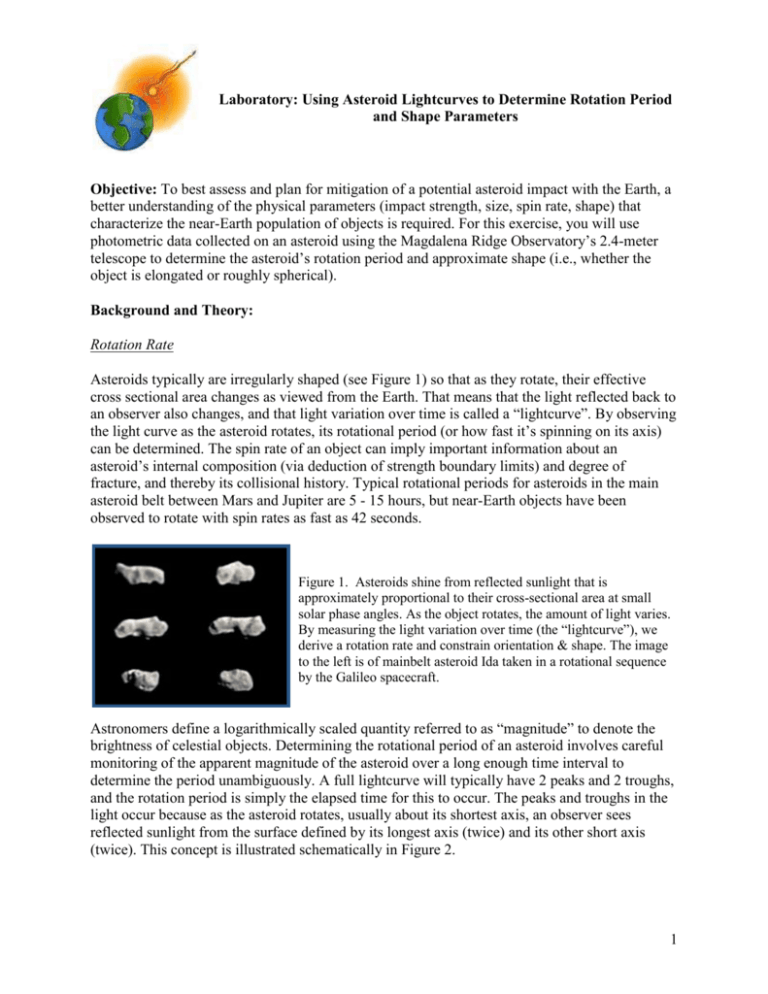
Laboratory: Using Asteroid Lightcurves to Determine Rotation Period and Shape Parameters Objective: To best assess and plan for mitigation of a potential asteroid impact with the Earth, a better understanding of the physical parameters (impact strength, size, spin rate, shape) that characterize the near-Earth population of objects is required. For this exercise, you will use photometric data collected on an asteroid using the Magdalena Ridge Observatory’s 2.4-meter telescope to determine the asteroid’s rotation period and approximate shape (i.e., whether the object is elongated or roughly spherical). Background and Theory: Rotation Rate Asteroids typically are irregularly shaped (see Figure 1) so that as they rotate, their effective cross sectional area changes as viewed from the Earth. That means that the light reflected back to an observer also changes, and that light variation over time is called a “lightcurve”. By observing the light curve as the asteroid rotates, its rotational period (or how fast it’s spinning on its axis) can be determined. The spin rate of an object can imply important information about an asteroid’s internal composition (via deduction of strength boundary limits) and degree of fracture, and thereby its collisional history. Typical rotational periods for asteroids in the main asteroid belt between Mars and Jupiter are 5 - 15 hours, but near-Earth objects have been observed to rotate with spin rates as fast as 42 seconds. Figure 1. Asteroids shine from reflected sunlight that is approximately proportional to their cross-sectional area at small solar phase angles. As the object rotates, the amount of light varies. By measuring the light variation over time (the “lightcurve”), we derive a rotation rate and constrain orientation & shape. The image to the left is of mainbelt asteroid Ida taken in a rotational sequence by the Galileo spacecraft. Astronomers define a logarithmically scaled quantity referred to as “magnitude” to denote the brightness of celestial objects. Determining the rotational period of an asteroid involves careful monitoring of the apparent magnitude of the asteroid over a long enough time interval to determine the period unambiguously. A full lightcurve will typically have 2 peaks and 2 troughs, and the rotation period is simply the elapsed time for this to occur. The peaks and troughs in the light occur because as the asteroid rotates, usually about its shortest axis, an observer sees reflected sunlight from the surface defined by its longest axis (twice) and its other short axis (twice). This concept is illustrated schematically in Figure 2. 1 Figure 2. Illustration of a lightcurve with relative magnitudes plotted on the y-axis, and elapsed time on the x-axis, and the maximum (M1 and M2) and minimum (m1 and m2) magnitudes noted. Asteroid Shape Parameters The amplitude (the vertical height from a peak to a trough) of a lightcurve varies with shape, with roughly spherical asteroids having smaller light amplitude variations than more ellipsoidshaped bodies. Referring to Figure 2, we can derive a formula for the largest amplitude (A) variation observed for a particular asteroid (where m is the magnitude) such that: A(max) = m = m(minimum) – m(maximum) Figure 3 shows the lightcurve of a roughly spherical simulated asteroid and its modest amplitude lightcurve, while Figure 4 shows the lightcurve for a more ellipsoidal-shaped asteroid. Figure 3. Resulting model lightcurve for a roughly spherically-shaped asteroid. Relative magnitudes are shown on the y-axis, and elapsed time on the x-axis. The amplitude is ~0.2 magnitudes (peak-to-trough). Figure 4. Resulting model lightcurve for a triaxial ellipsoidal-shaped asteroid. Relative magnitudes are shown on the y-axis, and elapsed time on the x-axis. The amplitude is about 0.65 magnitudes (peak-totrough variation), much larger than for a more spherical object. 2 The previous figures illustrate how a lightcurve can be used to infer an asteroid’s shape. Approximating the asteroid’s shape as an ellipsoid, we can express this graphically by defining equatorial and polar axes as shown in Figure 5. c c b Figure 5. Shown above is a triaxial ellipsoid model of an asteroid. In this case, a > b > c. The asteroid rotates about its shortest axis (i.e., “c”). The schematic on the left represents the maximum cross-sectional area of the ellipsoid facing the observer, and the one on the right, the minimum cross-sectional area. Brightness Measurements via Differential Photometry Differential photometry is the method of measuring the brightness of an object as it is changing with respect to constant background stars having a similar apparent magnitude. As the asteroid moves across the sky with respect to the stars in the background it will be rotating, and the amount of light reflected back to the observer will change (i.e., its lightcurve is varying). To measure the amount of reflected light, the images captured by the CCD camera are processed using an image reduction routine (for example, “IRAF”) at the telescope. Figure 6a shows a typical CCD image where the asteroid’s motion with respect to the stationary background stars is shown as a time-lapse of 11 composite images. Figure 6b shows a 3-D plot of a digital CCD image depicting how an object’s light is measured with respect to the sky background using an image processing routine. Figure 6 a, b. A typical CCD image is shown in (a), and a 3-D plot of light intensity from one of the objects in the image is shown in (b). 3 Procedure: STEP 1 The image above depicts a typical image of an asteroid and two comparison stars in the image field. We will not be measuring absolute magnitudes (the total calibrated light coming from the asteroid) but we will use differential photometry to determine how the relative light of the asteroid is changing with respect to the background stars (which we assume are constant and not changing). 1) Fill in the photometric dataset in the table below for data you take at the telescope for the asteroid and two comparison stars: Time (UT) Magnitude of Comparison Star #1 Magnitude of Comparison Star #2 Magnitude of Asteroid 3.00 14.80 15.611 16.749 3.08 14.81 15.611 16.684 3.12 14.77 15.585 16.602 3.15 14.77 15.581 16.571 3.20 14.77 15.577 16.492 3.23 14.77 15.578 16.435 3.28 14.77 15.572 16.416 3.32 14.78 15.569 16.389 3.40 14.78 15.568 16.399 3.48 14.77 15.560 16.457 (hours) (Star 2 – Star 1) (Asteroid Star 2) 4 a) Subtract the magnitudes of the comparison stars and plot the result to ensure that the light from these stars is constant and not varying. The x-axis should be time (UT) in hours and the y-axis should be the subtracted magnitudes. Is the result approximately a constant line as time progresses? b) Now on the same figure, plot the result of the asteroid magnitude subtracted from comparison star #2. Does this curve show some variation? An example of what your result might look like is shown below, with the blue line representing the comparison star variation (~constant), and the red, the asteroid (varying). c) Now use the data set (in file dorrit_spring10.dat) taken on asteroid 3416 Dorrit to plot UT time versus the change in asteroid magnitude. Your plot should look something like this: 5 Then, estimate the rotation period (in hours). Remember, the rotation period is the time it takes for the asteroid light variation to manifest 2 peaks and 2 troughs. 3614 Dorrit Rotation Period = ________. Estimate the amplitude of your lightcurve by subtracting the magnitude at a peak from the magnitude at a trough. 3614 Dorrit Amplitude = ___________. d) Repeat these steps using the data set (in file xf11_spring09.xls) taken on asteroid 1997 XF11 to plot UT time versus the change in asteroid magnitude. Your plot should look something like this: Then, estimate the rotation period (in hours). XF11 Rotation Period = ________. Estimate the amplitude of your lightcurve by subtracting the magnitude at a peak from the magnitude at a trough. XF11 Amplitude = ___________. 2) To a first approximation, the amount of light reflected from the asteroid can be estimated as proportional to its cross sectional area. Therefore, the measured magnitude (m) is: m = - 2.5 log(cross sectional area) + zero point Assuming the object is modeled as a triaxial ellipsoid, estimate the axial ratio (a/b) implied by the amplitude of your measured lightcurve for Dorrit. Repeat the calculation for Nefertiti. Hint: The formula for the cross-sectional area of an ellipsoid for the maximum surface area is πac and for the minimum surface area, πbc. 6 Therefore amplitude A is: A = m = m(minimum) – m(maximum) And: A = m = - 2.5 log(πbc) + 2.5 log(πac) = 2.5 log (a/b) So: (A/2.5) = log (a/b) 10 A/2.5 = (a/b) Axial Ratio a/b for Dorrit = _____________ Axial Ratio a/b for XF11 = _____________ 3) Is the asteroid Dorrit roughly spherical or more elongated? Explain using your result for axial ratio a/b for Dorrit. 4) Is the asteroid XF11 roughly spherical or more elongated? Explain using your result for axial ratio a/b for XF11. 7

