Chapter 6, 7, 8 Tutorial Questions
advertisement
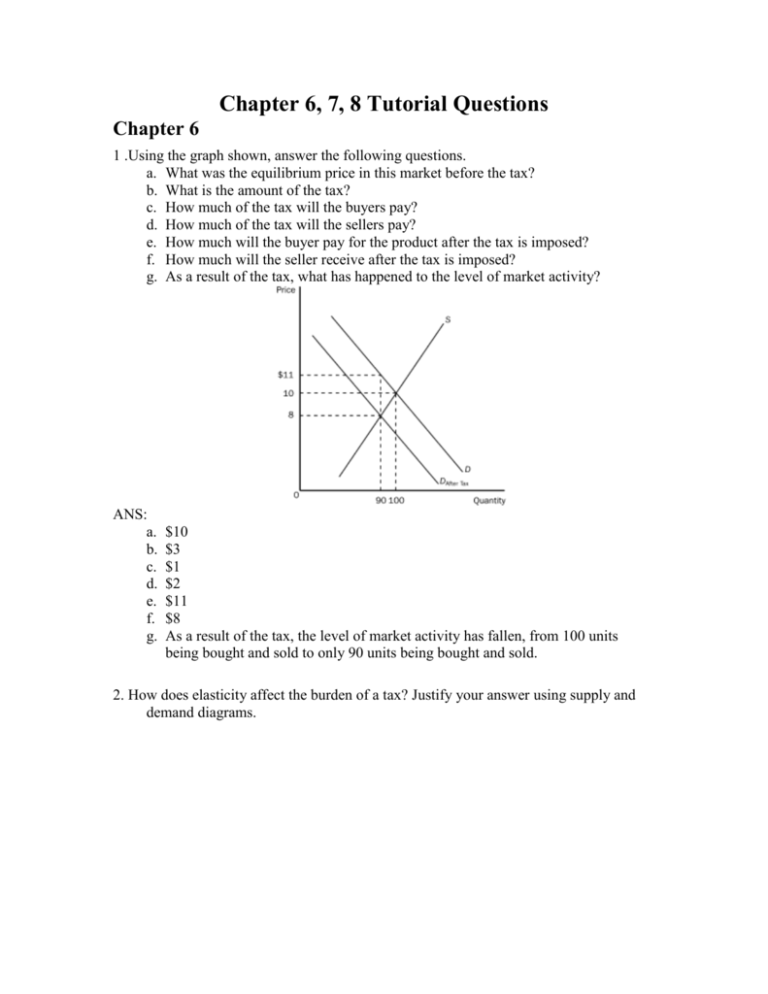
Chapter 6, 7, 8 Tutorial Questions Chapter 6 1 .Using the graph shown, answer the following questions. a. What was the equilibrium price in this market before the tax? b. What is the amount of the tax? c. How much of the tax will the buyers pay? d. How much of the tax will the sellers pay? e. How much will the buyer pay for the product after the tax is imposed? f. How much will the seller receive after the tax is imposed? g. As a result of the tax, what has happened to the level of market activity? ANS: a. b. c. d. e. f. g. $10 $3 $1 $2 $11 $8 As a result of the tax, the level of market activity has fallen, from 100 units being bought and sold to only 90 units being bought and sold. 2. How does elasticity affect the burden of a tax? Justify your answer using supply and demand diagrams. ANS: Chapter 7 Figure 7-1 3. Refer to Figure 7-1. When the price is P1, consumer surplus is a. A. b. A + B. c. A + B + C. d. A + B + D. ANS: C 4. Refer to Figure 7-1. When the price is P2, consumer surplus is a. A. b. B. c. A + B. d. A + B + C. ANS: A 5. Refer to Figure 7-1. When the price rises from P1 to P2, consumer surplus a. increases by an amount equal to A. b. decreases by an amount equal to B + C. c. increases by an amount equal to B + C. d. decreases by an amount equal to C. ANS: B 6. Refer to Figure 7-1. Area C represents a. the decrease in consumer surplus that results from a downward-sloping demand curve. b. consumer surplus to new consumers who enter the market when the price falls from P2 to P1. c. the increase in producer surplus when quantity sold increases from Q2 to Q1. d. the decrease in consumer surplus to each consumer in the market when the price increases from P1 to P2. ANS: B 7. Refer to Figure 7-1. When the price rises from P1 to P2, which of the following statements is not true? a. The buyers who still buy the good are worse off because they now pay more. b. Some buyers leave the market because they are not willing to buy the good at the higher price. c. Buyers place a higher value on the good after the price increase. d. Consumer surplus in the market falls. ANS: C Figure 7-4 8. Refer to Figure 7-4. Which area represents producer surplus when the price is P1? a. BCE b. ACF c. ABED d. DEF ANS: A 9. Refer to Figure 7-4. Which area represents producer surplus when the price is P2? a. BCE b. ACF c. ABED d. AFEB ANS: B 10. Refer to Figure 7-4. Which area represents the increase in producer surplus when the price rises from P1 to P2? a. BCE b. ACF c. ABED d. AFEB ANS: D 11. Refer to Figure 7-4. When the price rises from P1 to P2, which area represents the increase in producer surplus to existing producers? a. BCE b. ACF c. DEF d. ABED ANS: D 12. Refer to Figure 7-4. Which area represents the increase in producer surplus when the price rises from P1 to P2 due to new producers entering the market? a. BCE b. ACF c. DEF d. AFEB ANS: C Chapter 8 13.Use the following graph shown to fill in the table that follows. WITHOUT TAX WITH TAX CHANGE Consumer surplus Producer surplus Tax revenue Total surplus ANS: Consumer surplus Producer surplus Tax revenue Total surplus WITHOUT TAX A+B+C D+E+F None A+B+C+D+E+F WITH TAX A F B+D A+B+D+F CHANGE –(B + C) –(D + E) (B + D) –(C + E) 14. Using the graph shown, determine the value of each of the following: a. equilibrium price before the tax b. consumer surplus before the tax c. producer surplus before the tax d. total surplus before the tax e. consumer surplus after the tax f. producer surplus after the tax g. total tax revenue to the government h. total surplus (consumer surplus + producer surplus + tax revenue) after the tax i. deadweight loss ANS: a. b. c. d. e. f. g. h. i. $10 $3600 $2400 $6000 $900 $600 $3000 $4500 $1500

