Chapter 6s Outline
advertisement
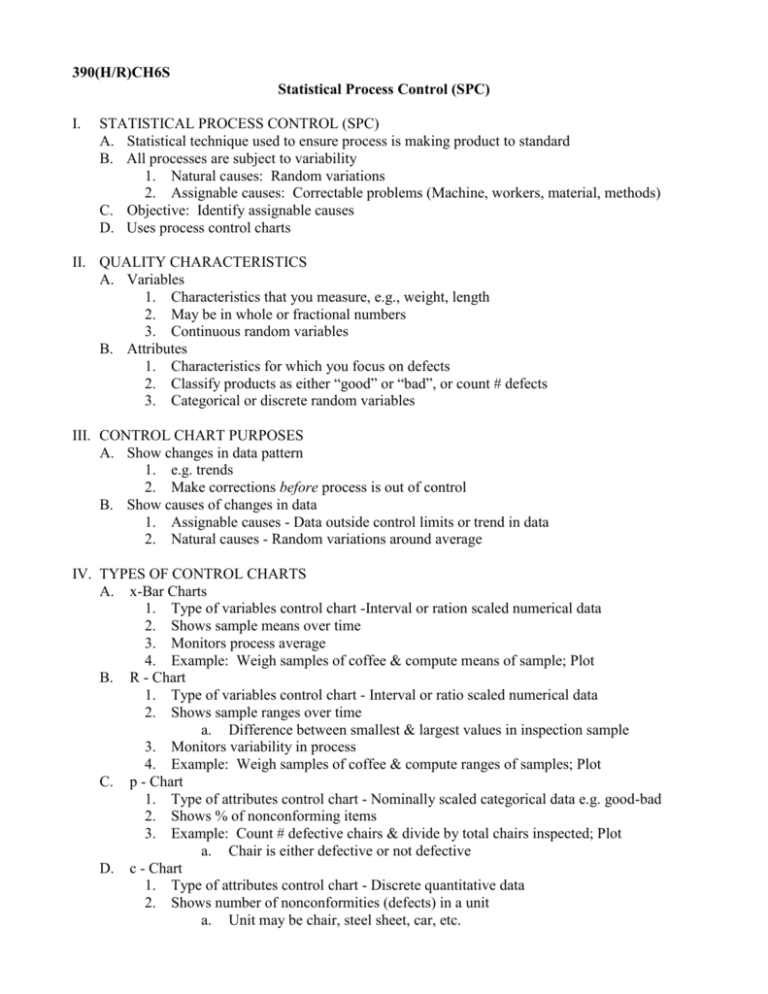
390(H/R)CH6S Statistical Process Control (SPC) I. STATISTICAL PROCESS CONTROL (SPC) A. Statistical technique used to ensure process is making product to standard B. All processes are subject to variability 1. Natural causes: Random variations 2. Assignable causes: Correctable problems (Machine, workers, material, methods) C. Objective: Identify assignable causes D. Uses process control charts II. QUALITY CHARACTERISTICS A. Variables 1. Characteristics that you measure, e.g., weight, length 2. May be in whole or fractional numbers 3. Continuous random variables B. Attributes 1. Characteristics for which you focus on defects 2. Classify products as either “good” or “bad”, or count # defects 3. Categorical or discrete random variables III. CONTROL CHART PURPOSES A. Show changes in data pattern 1. e.g. trends 2. Make corrections before process is out of control B. Show causes of changes in data 1. Assignable causes - Data outside control limits or trend in data 2. Natural causes - Random variations around average IV. TYPES OF CONTROL CHARTS A. x-Bar Charts 1. Type of variables control chart -Interval or ration scaled numerical data 2. Shows sample means over time 3. Monitors process average 4. Example: Weigh samples of coffee & compute means of sample; Plot B. R - Chart 1. Type of variables control chart - Interval or ratio scaled numerical data 2. Shows sample ranges over time a. Difference between smallest & largest values in inspection sample 3. Monitors variability in process 4. Example: Weigh samples of coffee & compute ranges of samples; Plot C. p - Chart 1. Type of attributes control chart - Nominally scaled categorical data e.g. good-bad 2. Shows % of nonconforming items 3. Example: Count # defective chairs & divide by total chairs inspected; Plot a. Chair is either defective or not defective D. c - Chart 1. Type of attributes control chart - Discrete quantitative data 2. Shows number of nonconformities (defects) in a unit a. Unit may be chair, steel sheet, car, etc. b. Size of unit must be constant Example: Count # defects (scratches, chips etc.) in each chair of a sample of 100 chairs; Plot Steps to follow when using control charts 1. Collect 20 to 25 samples of n=4 or n=5 from a stable process and compute the mean. 2. Compute the overall means, set approximate control limits, and calculate the preliminary upper and lower control limits. If the process is not currently stable, use the desired mean instead of the overall mean to calculate limits. 3. Investigate points of patterns that indicate the process is out of control. Assign causes for the variations. 4. Collect additional samples and revalidate the control limits. 3. E. V. WHAT IS ACCEPTANCE SAMPLING? A. Form of quality testing used for incoming materials or finished goods 1. e.g., purchased material & components B. Procedure 1. Take one or more samples at random from a lot (shipment) of items 2. Inspect each of the items in the sample 3. Decide whether to reject the whole lot based on the inspection results VI. AQL & LTPD A. Acceptable quality level (AQL) 1. Quality level of good lot 2. Producer (supplier) does not want lots with fewer defects than AQL rejected B. Lot tolerance percent defective (LTPD) 1. Quality level of a bad lot 2. Consumer (buyer) does not want lots with more defects than LTPD accepted VII. PRODUCER’S AND CONSUMER’S RISK A. Producer’s risk (a) 1. Probability of rejecting a good lot 2. Probability of rejecting a lot when fraction defective is AQL B. Consumer’s risk (ß) 1. Probability of accepting a bad lot 2. Probability of accepting a lot when fraction defective is LTPD. VIII. OPERATING CHARACTERISTIC CURVE A. Shows how well a sampling plan discriminates between good & bad lots (shipments) B. Shows the relationship between the probability of accepting a lot & its quality

