transverse standing waves
advertisement
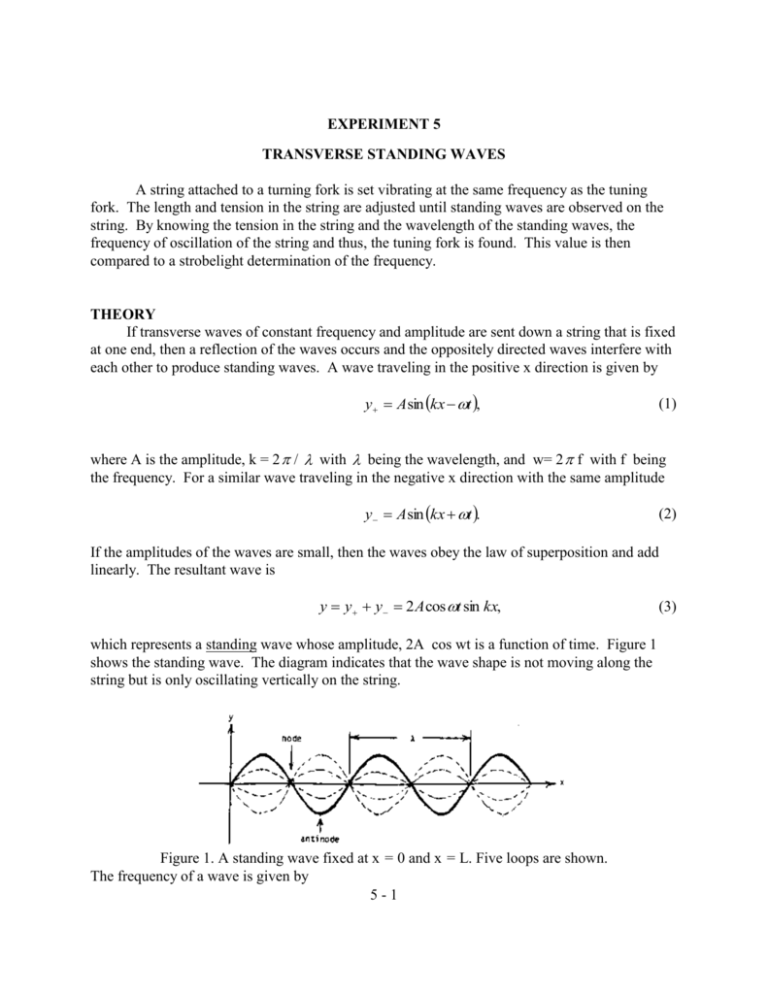
EXPERIMENT 5 TRANSVERSE STANDING WAVES A string attached to a turning fork is set vibrating at the same frequency as the tuning fork. The length and tension in the string are adjusted until standing waves are observed on the string. By knowing the tension in the string and the wavelength of the standing waves, the frequency of oscillation of the string and thus, the tuning fork is found. This value is then compared to a strobelight determination of the frequency. THEORY If transverse waves of constant frequency and amplitude are sent down a string that is fixed at one end, then a reflection of the waves occurs and the oppositely directed waves interfere with each other to produce standing waves. A wave traveling in the positive x direction is given by y A sin kx t , (1) where A is the amplitude, k = 2 / with being the wavelength, and w= 2 f with f being the frequency. For a similar wave traveling in the negative x direction with the same amplitude y A sin kx t . (2) If the amplitudes of the waves are small, then the waves obey the law of superposition and add linearly. The resultant wave is y y y 2 A cos t sin kx, which represents a standing wave whose amplitude, 2A cos wt is a function of time. Figure 1 shows the standing wave. The diagram indicates that the wave shape is not moving along the string but is only oscillating vertically on the string. Figure 1. A standing wave fixed at x = 0 and x = L. Five loops are shown. The frequency of a wave is given by 5-1 (3) f v (4) where V is the speed at which the transverse waves propagate along the string, The speed of the wave, in terms of the tension T, and the mass per unit length of the string is T v (5) The frequency is, therefore, f 1 T (6) An alternate expression that can be used to calculate the frequency is f N T 2L (7) where L is the length of N loops. Because the string is being driven at the same frequency as the tuning fork, the frequency of the tuning fork producing the standing waves is also given by (7). In the experiment a string is attached to one tine of an electrically-driven tuning fork. The other end of the string passes over a pulley to a weight hanger. (Refer to Figure 2.) The vibrating tuning fork sets up standing waves on the string and the amplitude of these waves can then be maximized by changing the weight on the weight hanger or by moving the entire tuning fork assembly toward or away from the pulley. Figure 2. The apparatus set up with standing waves on the string. 5-2 APPARATUS 0 0 0 0 0 0 electrically-driven tuning fork low voltage power supply 2 leads table clamp and upright right angle clamp rod-mounted pulley 0 0 0 0 0 0 weight hanger 3 - 50 gram slotted weights string, 2.5 meters long 2 meter long meter stick strobe light rubber mallet PROCEDURE a) Record the mass per unit length of the string, and its uncertainty, . b) Set up the apparatus as shown in Figure 2 with a total of 100 grams hanging from the end of the string. Connect the power supply to the tuning fork terminals with the two leads, and plug in the power supply. Record the total mass hanging from the end of the string. c) Squeeze the tines of the tuning fork together and release, or strike one tine with the rubber mallet. Then turn the adjustment screw on the side of the tuning fork until a constant vibration results. Lock the screw in place. d) Move the tuning fork assembly toward or away from the pulley until at least three loops are observed and the amplitude of the oscillation is at maximum. e) Use the meter stick to measure the distance L. from the first node away from the tuning fork to the first node away from the pulley. (The loops at the two ends of the string are not included because the end attached to the tuning fork is not a node due to the vibration of the tine, and the position of the node at the pulley end cannot be determined accurately due to the curvature of the pulley.) Record the number of loops, N. in the distance L, and record L and the uncertainty 6L. This uncertainty should reflect the fact that the positions of the nodes are difficult to observe. f) Change the mass hanging from the end of the string to 150 grams and repeat the experiment. Change to 200 grams and repeat again. g) Use the strobe light to find the frequency of the tuning fork. Set up the strobe light so that it illuminates the vibrating string. Turn on the strobe and find the highest frequency that will produce one image. The dial on the strobe gives the frequency in flashes per minute and has an accuracy of 1 %. 5-3 ANALYSIS Calculate the experimental value of the frequency f for each hanging mass and the corresponding Uncertainty, f. Report these values together with ' the strobe light value in a table. Also graph these values on one-dimensional graph using error bars. Offset the values vertically from one another. The uncertainty in the experimental value of the frequency of the turning fork can be found from (7) as L m (8) f=f L 2m 2 where T -mg, and g is the acceleration due to gravity. The mass m, has an uncertainty of 0.2grams. QUESTIONS 1. Show that (3) is the result of adding (1) and (2). 2. Show that = 2L / N, where L is the length of N loops. 3. Explain how the electrically driven tuning fork operates. 4. Why is it necessary to find the highest frequency of the strobe light that will produce one image? How do lower frequencies produce one image? What are the other frequencies 5. Derive (8) from (7). 6. In the calculation of the experimental frequency from (7), the mass associated with the length of the string hanging over the pulley was not taken into account. Suppose that the leng7th of string hanging over the pulley is 20 cm. By what percentage does the experimental value of the frequency change when the hanging mass is 100 grams? 5-4
