251solngr2
advertisement
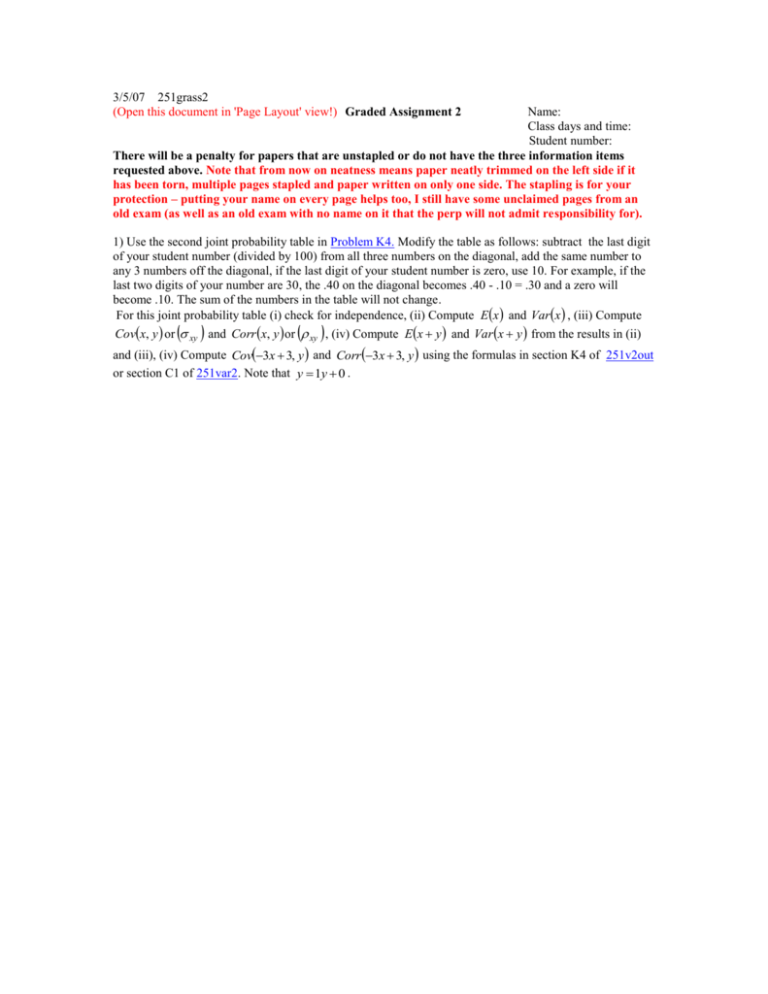
3/5/07 251grass2 (Open this document in 'Page Layout' view!) Graded Assignment 2 Name: Class days and time: Student number: There will be a penalty for papers that are unstapled or do not have the three information items requested above. Note that from now on neatness means paper neatly trimmed on the left side if it has been torn, multiple pages stapled and paper written on only one side. The stapling is for your protection – putting your name on every page helps too, I still have some unclaimed pages from an old exam (as well as an old exam with no name on it that the perp will not admit responsibility for). 1) Use the second joint probability table in Problem K4. Modify the table as follows: subtract the last digit of your student number (divided by 100) from all three numbers on the diagonal, add the same number to any 3 numbers off the diagonal, if the last digit of your student number is zero, use 10. For example, if the last two digits of your number are 30, the .40 on the diagonal becomes .40 - .10 = .30 and a zero will become .10. The sum of the numbers in the table will not change. For this joint probability table (i) check for independence, (ii) Compute E x and Varx , (iii) Compute Covx, y or xy and Corr x, y or xy , (iv) Compute Ex y and Var x y from the results in (ii) and (iii), (iv) Compute Cov3x 3, y and Corr 3x 3, y using the formulas in section K4 of 251v2out or section C1 of 251var2. Note that y 1y 0 . 2) The following data represent the scores of a group of students on a math placement test and their grades in a math course. Personalize the data by subtracting the second to last digit of your student number from the 45 in the x column. (i) Compute the sample mean and variance of x , (ii) Compute Covx, y or s xy and Corr x, y or rxy , (iii) Compute the sample mean and variance of x y from the results in (i) and (ii). (iv) Compute Cov6 x 3, y and Corr 6 x 3, y using the formulas in section K4 of 251v2out or section C1 of 251var2. Note that y 1y 0 . Test Score Grades y x 51 75 52 72 59 82 45 67 61 75 54 79 56 78 67 82 63 87 53 72 60 96 ————— 3/9/2007 2:04:45 PM ———————————————————— Welcome to Minitab, press F1 for help. 51 52 59 45 61 54 56 67 63 53 60 75 72 82 67 75 79 78 82 87 72 96 Results for: 1gr2-071.MTW MTB > WSave "C:\Documents and Settings\RBOVE\My Documents\Minitab\1gr2071.MTW"; SUBC> Replace. Saving file as: 'C:\Documents and Settings\RBOVE\My Documents\Minitab\1gr2-071.MTW' MTB > let c6 = c1 MTB > let c7 = c2 MTB > let c3 = c2*c1 MTB > let c3=c1*c1 MTB > let c4 = c2*c2 MTB > let c5 = c1*c2 MTB MTB MTB MTB > > > > let c8 = c6*c6 let c9 = c7*c7 let c10 = c6 * c7 print c1 - c5 Data Display Row 1 2 3 4 5 6 7 8 9 10 11 x 51 52 59 45 61 54 56 67 63 53 60 y 75 72 82 67 75 79 78 82 87 72 96 xsq 2601 2704 3481 2025 3721 2916 3136 4489 3969 2809 3600 ysq 5625 5184 6724 4489 5625 6241 6084 6724 7569 5184 9216 xy 3825 3744 4838 3015 4575 4266 4368 5494 5481 3816 5760 MTB > describe c1 c2 Descriptive Statistics: x, y Variable x y N 11 11 N* 0 0 Mean 56.45 78.64 SE Mean 1.89 2.42 StDev 6.27 8.03 MTB > corr c1 c2 Correlations: x, y Pearson correlation of x and y = 0.693 P-Value = 0.018 MTB > Covariance c1 c2. Covariances: x, y x y x 39.2727 34.8818 y 64.4545 MTB > sum c1 Sum of x Sum of x = 621 MTB > sum c2 Sum of y Sum of y = 865 MTB > sum c3 Sum of xsq Sum of xsq = 35451 MTB > sum c4 Sum of ysq Sum of ysq = 68665 MTB > sum c5 Sum of xy Sum of xy = 49182 Minimum 45.00 67.00 Q1 52.00 72.00 Median 56.00 78.00 Q3 61.00 82.00 Maximum 67.00 96.00 Row 1 2 3 4 5 6 7 8 9 10 11 x2 y x y2 xy 51 75 2601 5625 3825 52 72 2704 5184 3744 59 82 3481 6724 4838 45 67 2025 4489 3015 61 75 3721 5625 4575 54 79 2916 6241 4266 56 78 3136 6084 4368 67 82 4489 6724 5494 63 87 3969 7569 5481 53 72 2809 5184 3816 60 96 3600 9216 5760 621 865 35451 68665 49182 x 621, y 865 , x 35451 , x 621 56.4545 and y y 865 78.6364 . x 2 To summarize the results of these computations n 11 , y s x2 2 68665 and x 2 nx 2 n 1 xy 49182 . Thus n 11 n 11 35451 1156 .4545 2 392 .78373 39 .2784 . Minitab says 39.2727. 10 10 s x 39 .2784 6.2672 s 2y y 2 ny 2 n 1 68665 1178 .6364 2 644 .48254 64 .4483 . Minitab says 64.4545. 10 10 s x 64 .4483 8.0280 s xy x x y y xy nx y n 1 n 1 49182 1156 .4545 78 .6364 348 .83492 34 .8835 . Minitab 10 10 says 34.8818 rxy s xy sx s y 34 .8835 39 .2784 64 .4483 34 .8835 2 39 .2784 64 .4483 0.4807 .6933 . Minitab says .693. ————— 3/21/2007 12:52:31 PM ———————————————————— Welcome to Minitab, press F1 for help. MTB > WOpen "C:\Documents and Settings\RBOVE\My Documents\Minitab\1gr2071.MTW". Retrieving worksheet from file: 'C:\Documents and Settings\RBOVE\My Documents\Minitab\1gr2-071.MTW' Worksheet was saved on Fri Mar 09 2007 Results for: 1gr2-071a.MTW MTB > WSave "C:\Documents and Settings\RBOVE\My Documents\Minitab\1gr2071a.MTW"; SUBC> Replace. Saving file as: 'C:\Documents and Settings\RBOVE\My Documents\Minitab\1gr2-071a.MTW' MTB > print c6 - c10 Data Display Row 1 2 3 4 5 6 7 8 9 10 11 x1 51 52 59 36 61 54 56 67 63 53 60 y1 75 72 82 67 75 79 78 82 87 72 96 x1sq 2601 2704 3481 1296 3721 2916 3136 4489 3969 2809 3600 y1sq 5625 5184 6724 4489 5625 6241 6084 6724 7569 5184 9216 x1y1 3825 3744 4838 2412 4575 4266 4368 5494 5481 3816 5760 MTB > sum c6 Sum of x1 Sum of x1 = 612 MTB > sum c7 Sum of y1 Sum of y1 = 865 MTB > ssq c6 Sum of Squares of x1 Sum of squares (uncorrected) of x1 = 34722 MTB > sum c8 Sum of x1sq Sum of x1sq = 34722 MTB > sum c9 Sum of y1sq Sum of y1sq = 68665 MTB > sum c10 Sum of x1y1 Sum of x1y1 = 48579 MTB > describe c6 c7 Descriptive Statistics: x1, y1 Variable x1 y1 N 11 11 N* 0 0 Mean 55.64 78.64 SE Mean 2.47 2.42 StDev 8.20 8.03 MTB > covariance c6 c7 Covariances: x1, y1 x1 y1 x1 67.2545 45.3545 y1 64.4545 MTB > corr c6 c7 Correlations: x1, y1 Pearson correlation of x1 and y1 = 0.689 P-Value = 0.019 Minimum 36.00 67.00 Q1 52.00 72.00 Median 56.00 78.00 Q3 61.00 82.00 Maximum 67.00 96.00 Row 1 2 3 4 5 6 7 8 9 10 11 x2 y x y2 xy 51 75 2601 5625 3825 52 72 2704 5184 3744 59 82 3481 6724 4838 36 67 1296 4489 2412 61 75 3721 5625 4575 54 79 2916 6241 4266 56 78 3136 6084 4368 67 82 4489 6724 5494 63 87 3969 7569 5481 53 72 2809 5184 3816 60 96 3600 9216 5760 612 865 34722 68665 48579 x 612 , y 865 , x 34722 , x 612 55.6364 and y y 865 78.6364 . x 2 To summarize the results of these computations n 11 , y 2 68665 and x s x2 2 nx 2 n 1 xy 48579 . Thus n 11 n 11 34722 1155 .6364 2 672 .50094 67 .2501 . Minitab says 67.2545. 10 10 s x 67 .2501 8.2006 y s 2y 2 ny 2 n 1 68665 1178 .6364 2 644 .48254 64 .4483 . Minitab says 64.4545. 10 10 s x 64 .4483 8.0280 s xy x x y y xy nx y n 1 says 45.3545 rxy s xy sx s y n 1 45 .3492 67 .2501 64 .4483 48579 1155 .6364 78 .6364 453 .49175 45 .3492 . Minitab 10 10 45.3492 2 67 .2501 64.4483 0.4745 .6888 . Minitab says .689. MTB > describe c6 c7 Descriptive Statistics: x1, y1 Variable x1 y1 N 11 11 N* 0 0 Mean 55.64 78.64 SE Mean 2.47 2.42 StDev 8.20 8.03 Minimum 36.00 67.00 Q1 52.00 72.00 Median 56.00 78.00 Q3 61.00 82.00 MTB > corr c6 c7 Correlations: x1, y1 Pearson correlation of x1 and y1 = 0.689 P-Value = 0.019 MTB > covar c6 c7 Covariances: x1, y1 x1 y1 x1 67.2545 45.3545 y1 64.4545 MTB > Save "C:\Documents and Settings\RBOVE\My Documents\Minitab\1gr2071.MTW"; SUBC> Replace. Saving file as: 'C:\Documents and Settings\RBOVE\My Documents\Minitab\1gr2-071.MTW' Maximum 67.00 96.00 Existing file replaced. MTB > Data Display Row 1 2 3 4 5 6 7 8 9 10 11 x y xsq ysq xy 51 75 2601 5625 3825 52 72 2704 5184 3744 59 82 3481 6724 4838 45 67 2025 4489 3015 61 75 3721 5625 4575 54 79 2916 6241 4266 56 78 3136 6084 4368 67 82 4489 6724 5494 63 87 3969 7569 5481 53 72 2809 5184 3816 60 96 3600 9216 5760 621 865 35451 68665 49182 x 621, x 35451 , y 865 , y 68665 , x 621 56.454545 and y y 865 78.636364 . Then x So n 11, s x2 s 2y 2 n x 2 y 2 2 11 nx ny 2 n 1 xy 49162 . 11 35451 1156 .454545 39 .272728 , 10 68665 1178 .636364 2 64 .454483 . ( s x 39 .272728 6.2668 and 10 2 n 1 n and 2 s y 64.454483 8.0284 ). (ii) Compute Covx, y or s xy and Corr x, y or rxy . s xy Covx, y rxy s xy sx s y xy nxy 49182 1156.454545 78.636364 34.881835 n 1 Corr x, y 10 34 .881835 39 .272728 and 0.4806782 .6933 . The correlation and 64 .454483 covariance are positive, indicating a tendency of y to rise when x rises. rxy2 .4807 is neither large nor small on a zero to one scale, indicating that the relationship is not terribly strong. Note that 1 rxy 1 always! Descriptive Statistics: x, y Variable x y N 11 11 N* 0 0 Mean 56.45 78.64 SE Mean 1.89 2.42 StDev 6.27 8.03 MTB > corr c1 c2 Correlations: x, y Pearson correlation of x and y = 0.693 P-Value = 0.018 MTB > Covariance c1 c2. Covariances: x, y x y x 39.2727 34.8818 y 64.4545 Minimum 45.00 67.00 Q1 52.00 72.00 Median 56.00 78.00 Q3 61.00 82.00 Maximum 67.00 96.00
