Millikan`s Oil Drop
advertisement

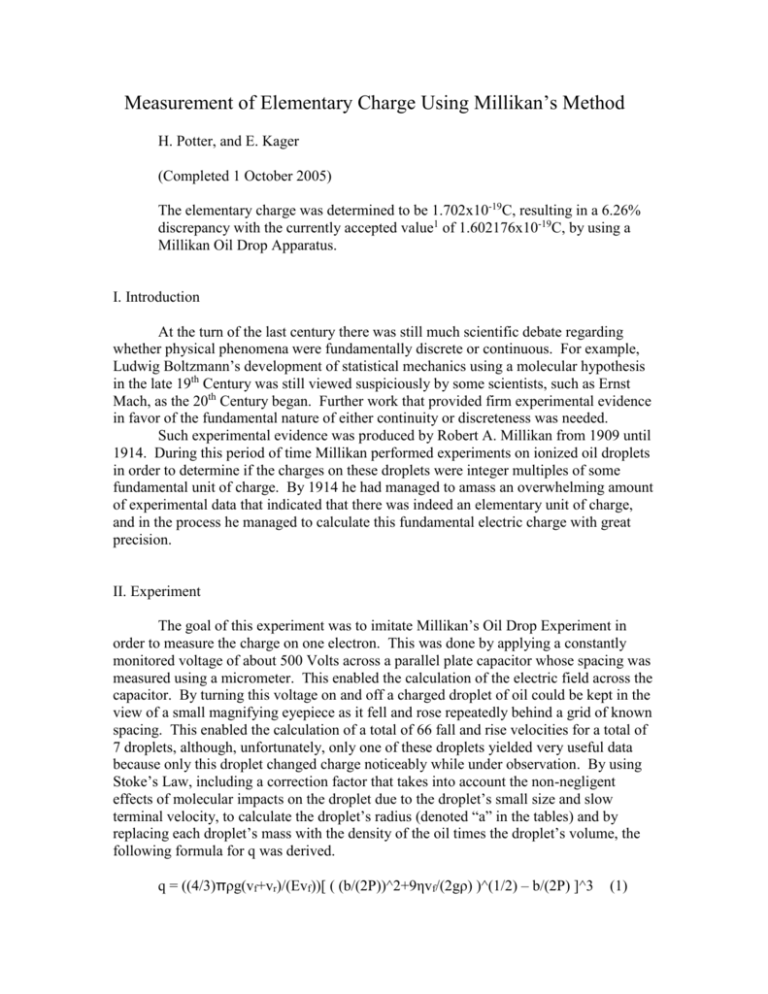
Measurement of Elementary Charge Using Millikan’s Method H. Potter, and E. Kager (Completed 1 October 2005) The elementary charge was determined to be 1.702x10⁻¹⁹C, resulting in a 6.26% discrepancy with the currently accepted value1 of 1.602176x10⁻¹⁹C, by using a Millikan Oil Drop Apparatus. I. Introduction At the turn of the last century there was still much scientific debate regarding whether physical phenomena were fundamentally discrete or continuous. For example, Ludwig Boltzmann’s development of statistical mechanics using a molecular hypothesis in the late 19th Century was still viewed suspiciously by some scientists, such as Ernst Mach, as the 20th Century began. Further work that provided firm experimental evidence in favor of the fundamental nature of either continuity or discreteness was needed. Such experimental evidence was produced by Robert A. Millikan from 1909 until 1914. During this period of time Millikan performed experiments on ionized oil droplets in order to determine if the charges on these droplets were integer multiples of some fundamental unit of charge. By 1914 he had managed to amass an overwhelming amount of experimental data that indicated that there was indeed an elementary unit of charge, and in the process he managed to calculate this fundamental electric charge with great precision. II. Experiment The goal of this experiment was to imitate Millikan’s Oil Drop Experiment in order to measure the charge on one electron. This was done by applying a constantly monitored voltage of about 500 Volts across a parallel plate capacitor whose spacing was measured using a micrometer. This enabled the calculation of the electric field across the capacitor. By turning this voltage on and off a charged droplet of oil could be kept in the view of a small magnifying eyepiece as it fell and rose repeatedly behind a grid of known spacing. This enabled the calculation of a total of 66 fall and rise velocities for a total of 7 droplets, although, unfortunately, only one of these droplets yielded very useful data because only this droplet changed charge noticeably while under observation. By using Stoke’s Law, including a correction factor that takes into account the non-negligent effects of molecular impacts on the droplet due to the droplet’s small size and slow terminal velocity, to calculate the droplet’s radius (denoted “a” in the tables) and by replacing each droplet’s mass with the density of the oil times the droplet’s volume, the following formula for q was derived. q = ((4/3)πρg(vf+vr)/(Evf))[ ( (b/(2P))^2+9ηvf/(2gρ) )^(1/2) – b/(2P) ]^3 (1) The abundance of variables warrants an explanation of what each variable represents. The density of the oil is ρ, the electric field between the capacitor plates is E, the fall velocity of each droplet is vf, the rise velocity of each droplet is vr, b is a constant that is needed as part of the correction factor for Stoke’s Law, g is the gravitational acceleration, P is the pressure of the air in the room, η is the viscosity of air as taken from a standard graph of viscosity of air as a function of temperature, and π is the usual 3.14…. The actual data collection procedure is summarized as follows. Measure the capacitor spacing, measure the air pressure, connect multimeters to constantly monitor the voltage across the capacitors and the resistance across the thermistor, level the apparatus using a bubble level, clean the capacitor plates, and focus the eyepiece, first on the wire grid using the reticle focusing ring and then on the focusing wire using the droplet focusing ring, before attempting to collect any data. The wire grid must be in fine focus, but the focusing ring is merely intended to give an approximate indication of what focus is appropriate for observing droplets. This latter focus must be constantly adjusted during data collection so that the droplet that is being followed is not lost. Now data collection can begin. Spray a light mist of oil into the viewing chamber with the voltage off. Adjust the focus described earlier and look at the entire viewing area as you do so. A powerful source of light, such as a halogen lamp, should make visible any droplets that come into view. If no droplets are seen, spray some more into the viewing chamber. Some practice may be required before success is regularly obtained. Once some droplets are in view, apply a voltage for a brief period of time and observe how the droplets react. Select one that rises as a voltage is applied and try to isolate it by repeatedly manipulating the voltage. Once this droplet is in clear view, begin timing how long it takes to fall through 5 grid spacings, a distance of .5mm, when no voltage is applied, and immediately afterwards when voltage is applied and it is rising. These fall and rise times should be recorded in pairs so that they can be analyzed appropriately. Once this has been done several times, make sure that you continue to keep the same drop in view as you present a source of radiation for a brief time period. This radiation is intended to ionize the droplet. Record several more measurements for the fall and rise times on the same droplet. They should be different. If they aren’t, try once again to ionize the droplet. Continue this process of measuring and then ionizing the droplet and measuring again until the droplet cannot be kept in view. Repeat the entire procedure for several droplets. III. Results A great many measurements were taken on numerous drops; however, only one droplet, Drop D, was observed to change charge over the course of observation. This was the only droplet from which a value for the charge of an electron could be reliably calculated, and its data is shown in Table 2, along with calculations in Table 9. All other data are included in the remaining tables. The values of relevant constants are also included in Table 1, as well as the equation of the linear plot used to calculate η for each droplet, and the accepted value for e. 2 Linear η From T Equation: Data Points: Linear Equation: η = mT + η0 T η Constants: b P 0.0082 100108 η0 15 1.8000E-05 m 32 1.8815E-05 4.7941E-08 1.7281E-05 g 9.81 d 0.00763 ρ e 881.5 1.602176E-19 Table 1: Determination of η via linear fit and all constants measured for experiment. All units are SI. Drop D: Entry Δx 25 5.E-04 *26 5.E-04 27 5.E-04 28 5.E-04 29 5.E-04 30 5.E-04 *31 5.E-04 32 5.E-04 33 5.E-04 34 5.E-04 35 5.E-04 36 5.E-04 37 5.E-04 38 5.E-04 Δtfall 29.03 27.44 20.64 24.44 16.13 28.09 22.12 22.78 24.37 22.75 25.94 22.07 25.71 25.88 Δtrise 1.13 0.60 0.63 0.56 0.60 0.69 1.90 1.65 1.88 1.88 1.87 1.94 1.57 1.78 v fall 1.72E-05 1.82E-05 2.42E-05 2.05E-05 3.10E-05 1.78E-05 2.26E-05 2.19E-05 2.05E-05 2.20E-05 1.93E-05 2.27E-05 1.94E-05 1.93E-05 v rise 4.42E-04 8.33E-04 7.94E-04 8.93E-04 8.33E-04 7.25E-04 2.63E-04 3.03E-04 2.66E-04 2.66E-04 2.67E-04 2.58E-04 3.18E-04 2.81E-04 V 503 503 503 503 503 503 503 503 503 503 503 503 503 503 R 2.107 2.107 2.107 2.107 2.107 2.107 2.107 2.107 2.107 2.107 2.107 2.107 2.107 2.107 T 23.0 23.0 23.0 23.0 23.0 23.0 23.0 23.0 23.0 23.0 23.0 23.0 23.0 23.0 η 1.838E-05 1.838E-05 1.838E-05 1.838E-05 1.838E-05 1.838E-05 1.838E-05 1.838E-05 1.838E-05 1.838E-05 1.838E-05 1.838E-05 1.838E-05 1.838E-05 E 6.592E+04 6.592E+04 6.592E+04 6.592E+04 6.592E+04 6.592E+04 6.592E+04 6.592E+04 6.592E+04 6.592E+04 6.592E+04 6.592E+04 6.592E+04 6.592E+04 a 3.670E-07 3.786E-07 4.422E-07 4.033E-07 5.051E-07 3.737E-07 4.259E-07 4.191E-07 4.040E-07 4.194E-07 3.904E-07 4.264E-07 3.923E-07 3.909E-07 q 7.250E-19 1.393E-18 1.604E-18 1.609E-18 1.975E-18 1.196E-18 5.365E-19 5.989E-19 5.057E-19 5.310E-19 4.862E-19 5.271E-19 5.765E-19 5.100E-19 Table 2: This contains all data for Drop D, the data that was used in the determination of the experimental value of e. Notice that the droplet has 2 distinct charges for entries 2630 and 31-38. All units are SI. Drop A: Entry Δx 1 5.E-04 2 5.E-04 3 5.E-04 4 5.E-04 5 5.E-04 6 5.E-04 7 5.E-04 8 5.E-04 9 5.E-04 10 5.E-04 11 5.E-04 Δtfall 32.35 41.65 46.18 33.75 45.34 40.38 37.16 30.31 36.16 31.06 43.50 Δtrise 2.88 2.97 2.84 2.62 2.84 2.75 3.06 2.71 2.91 2.88 2.69 v fall 1.55E-05 1.20E-05 1.08E-05 1.48E-05 1.10E-05 1.24E-05 1.35E-05 1.65E-05 1.38E-05 1.61E-05 1.15E-05 v rise 1.74E-04 1.68E-04 1.76E-04 1.91E-04 1.76E-04 1.82E-04 1.63E-04 1.85E-04 1.72E-04 1.74E-04 1.86E-04 V 502 502 502 502 502 502 502 502 502 502 502 R 2.006 2.006 2.006 2.006 2.006 2.006 2.006 2.006 2.006 2.006 2.006 T 25.0 25.0 25.0 25.0 25.0 25.0 25.0 25.0 25.0 25.0 25.0 η 1.848E-05 1.848E-05 1.848E-05 1.848E-05 1.848E-05 1.848E-05 1.848E-05 1.848E-05 1.848E-05 1.848E-05 1.848E-05 E 6.579E+04 6.579E+04 6.579E+04 6.579E+04 6.579E+04 6.579E+04 6.579E+04 6.579E+04 6.579E+04 6.579E+04 6.579E+04 a 3.467E-07 3.013E-07 2.843E-07 3.387E-07 2.873E-07 3.065E-07 3.211E-07 3.594E-07 3.260E-07 3.546E-07 2.940E-07 q 2.808E-19 2.262E-19 2.184E-19 2.970E-19 2.214E-19 2.487E-19 2.395E-19 3.115E-19 2.561E-19 2.893E-19 2.403E-19 T 25.3 25.3 25.3 25.3 25.3 25.3 25.3 25.3 η 1.849E-05 1.849E-05 1.849E-05 1.849E-05 1.849E-05 1.849E-05 1.849E-05 1.849E-05 E 6.579E+04 6.579E+04 6.579E+04 6.579E+04 6.579E+04 6.579E+04 6.579E+04 6.579E+04 a 3.823E-07 4.256E-07 3.940E-07 3.628E-07 4.380E-07 3.341E-07 3.847E-07 3.287E-07 q 4.186E-19 4.992E-19 4.230E-19 1.748E-19 5.185E-19 3.511E-19 4.047E-19 3.293E-19 Table 3: All data for Drop A. All units are SI. Drop B: Entry Δx 12 5.E-04 13 5.E-04 14 5.E-04 15 5.E-04 16 5.E-04 17 5.E-04 18 5.E-04 19 5.E-04 Δtfall 27.12 22.28 25.66 29.82 21.13 34.63 26.81 35.66 Δtrise 2.15 2.07 2.22 5.28 2.07 2.15 2.25 2.25 v fall 1.84E-05 2.24E-05 1.95E-05 1.68E-05 2.37E-05 1.44E-05 1.86E-05 1.40E-05 v rise 2.33E-04 2.42E-04 2.25E-04 9.47E-05 2.42E-04 2.33E-04 2.22E-04 2.22E-04 V 502 502 502 502 502 502 502 502 R 1.985 1.985 1.985 1.985 1.985 1.985 1.985 1.985 Table 4: All data for Drop B. All units are SI. 3 Drop C: Entry Δx 20 5.E-04 21 5.E-04 22 5.E-04 23 5.E-04 24 5.E-04 Δtfall 38.94 35.72 25.37 43.72 29.88 Δtrise 1.78 1.75 1.69 1.78 1.61 v fall 1.28E-05 1.40E-05 1.97E-05 1.14E-05 1.67E-05 v rise 2.81E-04 2.86E-04 2.96E-04 2.81E-04 3.11E-04 V 502 502 502 502 502 R 1.973 1.973 1.973 1.973 1.973 T 25.5 25.5 25.5 25.5 25.5 η 1.850E-05 1.850E-05 1.850E-05 1.850E-05 1.850E-05 E 6.579E+04 6.579E+04 6.579E+04 6.579E+04 6.579E+04 a 3.130E-07 3.284E-07 3.966E-07 2.934E-07 3.625E-07 q 3.864E-19 4.177E-19 5.499E-19 3.555E-19 5.131E-19 T 23.5 23.5 23.5 23.5 23.5 23.5 23.5 23.5 23.5 η 1.841E-05 1.841E-05 1.841E-05 1.841E-05 1.841E-05 1.841E-05 1.841E-05 1.841E-05 1.841E-05 E 6.619E+04 6.619E+04 6.619E+04 6.619E+04 6.619E+04 6.619E+04 6.619E+04 6.619E+04 6.619E+04 a 3.613E-07 3.431E-07 3.477E-07 3.949E-07 3.511E-07 2.965E-07 3.521E-07 3.636E-07 3.451E-07 q 4.431E-19 4.442E-19 4.841E-19 5.321E-19 4.429E-19 3.564E-19 4.353E-19 4.786E-19 4.551E-19 T 24.2 24.2 24.2 24.2 24.2 24.2 24.2 24.2 24.2 η 1.844E-05 1.844E-05 1.844E-05 1.844E-05 1.844E-05 1.844E-05 1.844E-05 1.844E-05 1.844E-05 E 6.632E+04 6.632E+04 6.632E+04 6.632E+04 6.632E+04 6.632E+04 6.632E+04 6.632E+04 6.632E+04 a 3.299E-07 3.288E-07 3.399E-07 3.000E-07 3.320E-07 3.101E-07 3.507E-07 3.730E-07 3.163E-07 q 2.234E-19 2.110E-19 2.486E-19 1.912E-19 2.092E-19 2.032E-19 2.408E-19 2.683E-19 1.987E-19 T 24.6 24.6 24.6 24.6 24.6 24.6 24.6 24.6 24.6 24.6 η 1.846E-05 1.846E-05 1.846E-05 1.846E-05 1.846E-05 1.846E-05 1.846E-05 1.846E-05 1.846E-05 1.846E-05 E 6.645E+04 6.645E+04 6.645E+04 6.645E+04 6.645E+04 6.645E+04 6.645E+04 6.645E+04 6.645E+04 6.645E+04 a 3.529E-07 2.716E-07 3.316E-07 3.273E-07 2.793E-07 3.120E-07 3.455E-07 3.451E-07 3.646E-07 3.387E-07 q 2.157E-19 1.711E-19 1.998E-19 2.381E-19 1.694E-19 2.046E-19 2.332E-19 2.220E-19 2.779E-19 2.201E-19 Table 5: All data for Drop C. All units are SI. Drop E: Entry Δx 39 5.E-04 40 5.E-04 41 5.E-04 42 5.E-04 43 5.E-04 44 5.E-04 45 5.E-04 46 5.E-04 47 5.E-04 Δtfall 29.91 32.84 32.06 25.44 31.50 42.69 31.34 29.56 32.50 Δtrise 1.85 1.72 1.60 1.72 1.78 1.78 1.82 1.72 1.69 v fall 1.67E-05 1.52E-05 1.56E-05 1.97E-05 1.59E-05 1.17E-05 1.60E-05 1.69E-05 1.54E-05 v rise 2.70E-04 2.91E-04 3.13E-04 2.91E-04 2.81E-04 2.81E-04 2.75E-04 2.91E-04 2.96E-04 V 505 505 505 505 505 505 505 505 505 R 2.078 2.078 2.078 2.078 2.078 2.078 2.078 2.078 2.078 Table 6: All data for Drop E. All units are SI. Drop F: Entry Δx 48 5.E-04 49 5.E-04 50 5.E-04 51 5.E-04 52 5.E-04 53 5.E-04 54 5.E-04 55 5.E-04 56 5.E-04 Δtfall 35.31 35.54 33.47 41.88 34.91 39.47 31.63 28.28 38.10 Δtrise 3.40 3.60 3.16 3.50 3.69 3.44 3.43 3.34 3.63 v fall 1.42E-05 1.41E-05 1.49E-05 1.19E-05 1.43E-05 1.27E-05 1.58E-05 1.77E-05 1.31E-05 v rise 1.47E-04 1.39E-04 1.58E-04 1.43E-04 1.36E-04 1.45E-04 1.46E-04 1.50E-04 1.38E-04 V 506 506 506 506 506 506 506 506 506 R 2.042 2.042 2.042 2.042 2.042 2.042 2.042 2.042 2.042 Table 7: All data for Drop F. All units are SI. Drop G: Entry Δx 57 5.E-04 58 5.E-04 59 5.E-04 60 5.E-04 61 5.E-04 62 5.E-04 63 5.E-04 64 5.E-04 65 5.E-04 66 5.E-04 Δtfall 31.31 50.03 35.03 35.87 47.60 39.09 32.53 32.59 29.50 33.72 Δtrise 3.91 3.41 3.87 3.13 3.59 3.44 3.47 3.66 3.10 3.59 v fall 1.60E-05 9.99E-06 1.43E-05 1.39E-05 1.05E-05 1.28E-05 1.54E-05 1.53E-05 1.69E-05 1.48E-05 v rise 1.28E-04 1.47E-04 1.29E-04 1.60E-04 1.39E-04 1.45E-04 1.44E-04 1.37E-04 1.61E-04 1.39E-04 V 507 507 507 507 507 507 507 507 507 507 R 2.018 2.018 2.018 2.018 2.018 2.018 2.018 2.018 2.018 2.018 Table 8: All data for Drop G. All units are SI. IV. Analysis and Discussion The best estimate for e was taken to be the difference between the two distinct mean charges for Drop D, divided by the largest integer such that the result was larger 4 than the smallest charge observed throughout the entire experiment. It was thought that this would give the most accurate value for e because the smallest observed charge should probably be of a droplet with the elementary charge whose determination was randomly a bit smaller that its true value. The difference between the distinct average charges on Drop D should therefore be some multiple of this value, which should be very close to, but a bit larger than, the smallest observed charge. Thus a value of 1.702x10⁻¹⁹ Coulombs was calculated for e, a 6.26% discrepancy with the presently accepted value1. Drop D Analysis: Overall Min: First Mean: Second Mean: Difference: Value For e: Percent Discrepancy: 1.694E-19 1.555E-18 5.340E-19 1.021E-18 1.702E-19 6.26% Table 9: The two distinct mean charges on Drop D. The best estimate for e was taken to be the difference between the means divided by the largest integer such that the result was larger than the smallest charge observed throughout the entire experiment. All units are SI. V. Conclusion It is hard to estimate how much uncertainty is inherent in this experiment, but the accuracy of the difference method for determining e from the data seems to counteract the inherent uncertainty accompanying so many meticulous observations, as does the fact that so many times are recorded for a single drop, and many drops are typically compared. Thus I’d estimate that an uncertainty of 5% either way, a somewhat typical experimental error for a classroom experiment, is to be expected from the apparatus and experimental procedure. In this specific implementation of the procedure, however, not enough droplets whose charge changed significantly were observed, and thus the experimentally calculated value for e had a large percentage discrepancy, a good indication that the uncertainty in the data used in the data analysis presented above was correspondingly larger given the fact that only one charge’s data was used. The greatest gain in experimental precision would result from recording data on a greater number of droplets for a greater period of time, making sure to utilize a source of radiation to change the charge on each droplet several times before it is lost. This latter consideration is critical, as the bulk of useless data presented above makes clear. Each droplet must be observed possessing several distinct charges in order to make data analysis possible. Simply plotting each charge recorded for each droplet in an effort to see a clear step function is futile as the variability in the data will make such a graph appear continuous. 1 Tipler, Paul A. and Ralph A. Llewellyn, Modern Physics, 3rd ed. (W. H. Freeman and Company, New York 2003). 5


