HW2
advertisement

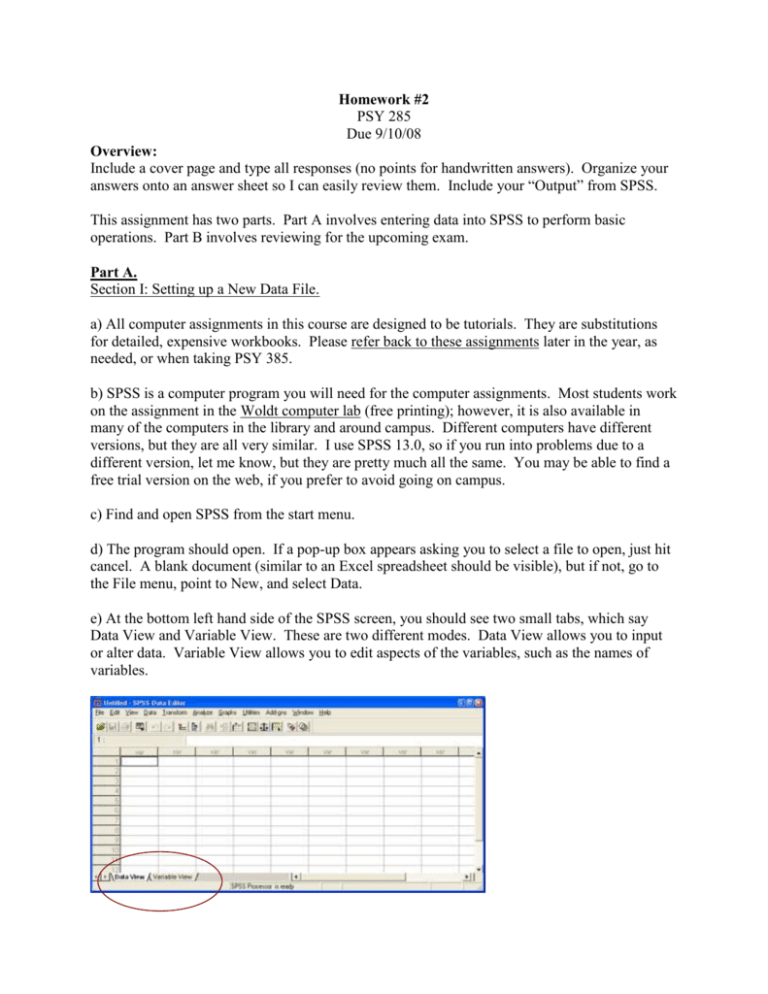
Homework #2 PSY 285 Due 9/10/08 Overview: Include a cover page and type all responses (no points for handwritten answers). Organize your answers onto an answer sheet so I can easily review them. Include your “Output” from SPSS. This assignment has two parts. Part A involves entering data into SPSS to perform basic operations. Part B involves reviewing for the upcoming exam. Part A. Section I: Setting up a New Data File. a) All computer assignments in this course are designed to be tutorials. They are substitutions for detailed, expensive workbooks. Please refer back to these assignments later in the year, as needed, or when taking PSY 385. b) SPSS is a computer program you will need for the computer assignments. Most students work on the assignment in the Woldt computer lab (free printing); however, it is also available in many of the computers in the library and around campus. Different computers have different versions, but they are all very similar. I use SPSS 13.0, so if you run into problems due to a different version, let me know, but they are pretty much all the same. You may be able to find a free trial version on the web, if you prefer to avoid going on campus. c) Find and open SPSS from the start menu. d) The program should open. If a pop-up box appears asking you to select a file to open, just hit cancel. A blank document (similar to an Excel spreadsheet should be visible), but if not, go to the File menu, point to New, and select Data. e) At the bottom left hand side of the SPSS screen, you should see two small tabs, which say Data View and Variable View. These are two different modes. Data View allows you to input or alter data. Variable View allows you to edit aspects of the variables, such as the names of variables. f) Make sure you are on Data View. We are going to enter some data. In SPSS, rows are numbered and go across. Each row will represent a different person in the data file. Along the top, columns are labeled “var” and each column represents a different variable. g) Enter the following data so that your screen looks like mine. Check your work to avoid errors. You will notice that once you start entering data, SPSS changes the column names from “var” to something arbitrary, like “VAR00001” – do not worry about that for now. h) Often students get confused about what this data means. To help, look at the first row (across). Participant #1 got a 1 on the first variable, a 19 on the second variable, an 8 on the third variable, and so forth. This is still a bit confusing because we do not know what each of these scores mean. i) Switch to Variable View by clicking on the tab near the bottom left of the screen. It should look like this: j) In variable view, we can tell SPSS how to name each variable so the data file is less confusing. The numbers along the left side now represent different variables. The columns across the top represent different attributes about the variables. Find the Name column near the left side. Here we see the arbitrary names SPSS assigned to our variables. Rename them as follows: participant, age, happy, satisfied, anxious, assertive, and depressed. We generally do not need to edit any of the other columns. Your screen should look like the following. k) Switch back to Data View. You should now see your variables names at the top of each column. This makes interpretation a lot easier. For example, participant #1 is apparently 19 years old, had a happiness score of 8, a satisfied score of 4, an anxiety score of 2.6, and a depression score of 10. For the particular scales used in this study, happiness and satisfaction were rated from 1-9, anxiety from 1-5, and depression from 0-40. Thus, this individual is very happy, a little low on satisfaction, in the middle on anxiety, and low on depression. l) Sometimes it can be useful to combine scores in SPSS. Look at the menus across the top of SPSS. Browse through the different menus. Usually, we rely most on the Transform menu and the Analyze menu. Transform allows us to alter the data (much like how you could use formulas in Excel), and Analyze does the statistical operations (like calculating correlations). Go the Transform menu and select Compute. m) We are going to combine the happy and satisfied variables to make a well-being variable. In the window that pops up, find where it says Target Variable and type “wellbeing” without any punctuation marks. This is going to be the name of our new variable. Then click on the word “happy” in the box below. Click on the triangle button to the right, which moves “happy” to the Numeric Expression box. Now click on the little plus sign near the middle of the screen. This adds a plus sign to the Numeric Expression box. Now click on the word “satisfied” and use the triangle button to add it to the Numeric Expression box. We are telling SPSS to add happy scores to the satisfied scores to yield a new variable called wellbeing. You would also use this box if you ever need to subtract, multiple, divide, or conduct other operations to scores. If your window looks like mine below, click the OK button. n) The wellbeing variable has been added. Your data should look like the following. Section II: Getting Basic Descriptive Statistics a) You can get many of the important descriptive statistics for a variable by going to the Analyze menu, pointing to Descriptive Statistics, and choosing Descriptives. b) In the window that pops up, click on the variable whose descriptive statistics you desire and move it to the “Variable(s)” section of the window using the triangle button. Try this using the “age” variable. Then, click on the Options button. This makes another window pop-up, where you can choose the descriptive statistics you want. Make sure Mean, Std. Deviation, Minimum, and Maximum are selected. Click the Continue button and then the OK button. c) A new window will appear. This is called the Output window. It shows the results for any statistical operation you perform. It should look like the following. Descriptives De scri ptive Statistics N age Valid N (lis twis e) 20 20 Minimum 18.00 Maximum 20.00 Mean 18.7500 St d. Deviat ion .63867 Section III. Getting Correlations a) To find the correlation between two variables, go to the Analyze menu, point to Correlate, and choose Bivariate. A window will pop up. Select and move at least two variables to the “Variable:” section of the pop-up window. If you choose two variables, it will correlate them. If you choose more than two, it will give you all possible correlations among the combinations of variables. Choose “happy” and “satisfied” and then click OK. b) The Output should look like the following (my red boxes have been added): Correlations Correl ations happy happy satisfied Pearson Correlation Sig. (2-tailed) N Pearson Correlation Sig. (2-tailed) N 1 20 .367 .112 20 satisfied .367 .112 20 1 20 c) Everything in the Output is repeated twice in the correlation box. Students often get confused because there are several different numbers in the correlation box. The .367 means that there is a correlation of r = .367 between the variables. To make sure you’re finding the right number, find one variable along the left side (e.g. “happy”). Then follow it across until you find the other variable (e.g. “satisfied”). The top number is the Pearson Correlation. Below it is the significance value (.112, don’t worry about this for now), followed by the sample size (20). d) Get more practice with correlations. This time run the same commands, but enter three variables in the correlation pop-up window. Choose happy, satisfied, and wellbeing. Your Output should look like this (minus the red boxes). Correlations Correl ations happy happy satisfied wellbeing Pearson Correlation Sig. (2-tailed) N Pearson Correlation Sig. (2-tailed) N Pearson Correlation Sig. (2-tailed) N 1 20 .367 .112 20 .858** .000 20 satisfied .367 .112 20 1 wellbeing .858** .000 20 .793** .000 20 20 .793** 1 .000 20 20 **. Correlation is s ignificant at t he 0.01 level (2-t ailed). e) These tables become more complex as more variables are included. To find the correlation between wellbeing and satisfaction, first find wellbeing along the left, and follow across until you get to the satisfied column. The top number (.793) is their correlation. f) The correlation between happy and satisfied is .367. The correlation between wellbeing and being happy is .858. Notice that each correlation appears in the table twice. Remember to avoid accidentally using the non-correlation values in the table. Section IV. SPSS Homework Problems Remember to include all Output. 1. What is the mean score for the happy variable? [2pts] 5.80 2. What is the mean score for the wellbeing variable? [2pts] 11.85 3. What is the standard deviation for the anxious variable? [2pts] 0.64 4. What is the standard deviation for the assertive variable? [2pts] 0.57 5. What is the correlation between depression and wellbeing? [2pts] -0.56 6. What is the correlation between anxiety and depression? [2pts] 0.59 7. Ignoring the participant number and age variables, which of the remaining variables correlates most strongly (biggest value, positive or negative) with assertiveness? [2pts] anxious 8. Ignoring the participant number and age variables, which of the remaining variables correlates least (weakest value, positive or negative) with depression? [2pts] assertive 9. How might a researcher modify the variables in the current data set to make a new one, called “poor mental health”? [2pts] Answers will vary. Perhaps, depression + anxiety – happy – satisfied. Part B. Section V. Exam Preparation To prepare for the exam, devise 6 good multiple choice questions that you think might appear on the exam. These can be from the readings or lecture. Questions should be well-written and of modest difficulty. Also, indicate the correct answer. [2pts each]


