Lesson Plan
advertisement
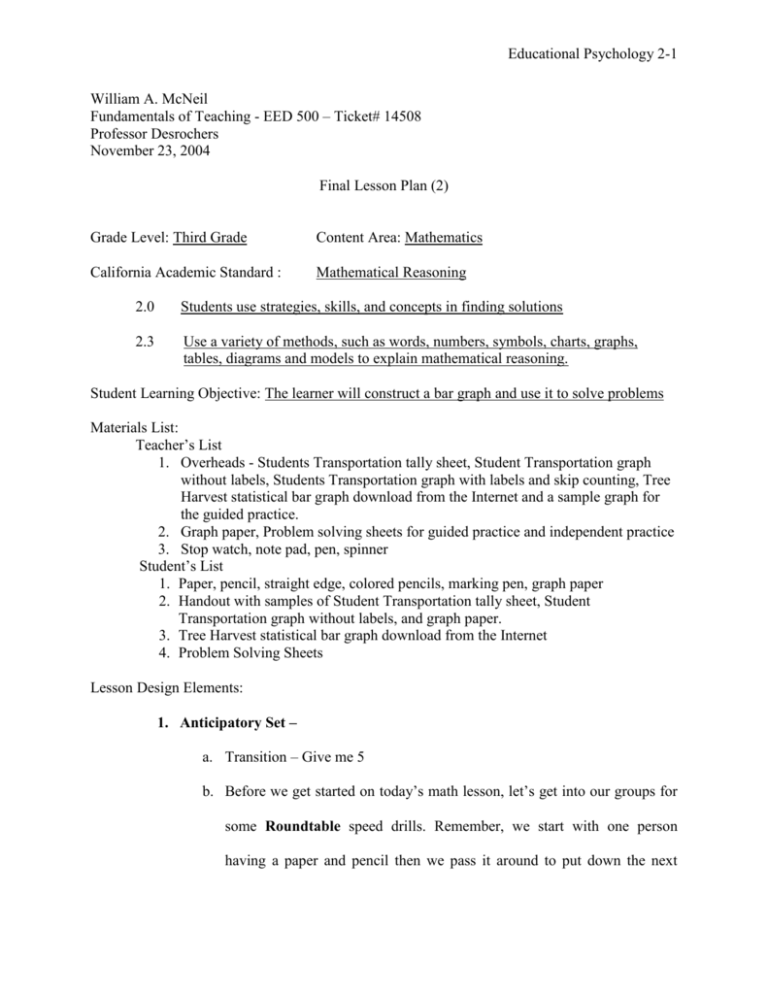
Educational Psychology 2-1 William A. McNeil Fundamentals of Teaching - EED 500 – Ticket# 14508 Professor Desrochers November 23, 2004 Final Lesson Plan (2) Grade Level: Third Grade Content Area: Mathematics California Academic Standard : Mathematical Reasoning 2.0 Students use strategies, skills, and concepts in finding solutions 2.3 Use a variety of methods, such as words, numbers, symbols, charts, graphs, tables, diagrams and models to explain mathematical reasoning. Student Learning Objective: The learner will construct a bar graph and use it to solve problems Materials List: Teacher’s List 1. Overheads - Students Transportation tally sheet, Student Transportation graph without labels, Students Transportation graph with labels and skip counting, Tree Harvest statistical bar graph download from the Internet and a sample graph for the guided practice. 2. Graph paper, Problem solving sheets for guided practice and independent practice 3. Stop watch, note pad, pen, spinner Student’s List 1. Paper, pencil, straight edge, colored pencils, marking pen, graph paper 2. Handout with samples of Student Transportation tally sheet, Student Transportation graph without labels, and graph paper. 3. Tree Harvest statistical bar graph download from the Internet 4. Problem Solving Sheets Lesson Design Elements: 1. Anticipatory Set – a. Transition – Give me 5 b. Before we get started on today’s math lesson, let’s get into our groups for some Roundtable speed drills. Remember, we start with one person having a paper and pencil then we pass it around to put down the next Educational Psychology 2-2 answer. Let’s start by counting to 100 by 2s. I’ll use a stopwatch and mark down the time when you’re done. Now by 3s, 4s, then 5s. …5s were easiest weren’t they? c. Last week we learned how to use tally sheets and turn them into pictographs. Remember the fun we had making the one with the cars and buses. Some required us to only draw ½ of a bus or ½ of a smiley face. 2. Objective Well, today we are going to start making what we call bar graphs with scales. Not the fish kind, but a way to make reading the graph much easier and more practical than the pictograph. Purpose Once you are able to “master” the simple bar graph, we are going to be able to use them to solve problems and interpret or understand data, much like we did with the pictograph. Whenever you use the Internet or encyclopedias for any of your research projects, you may find a lot of data that is in the form of a bar graph, so you will need to know how to read and interpret them. 3. Input – a. Let’s start by looking at the tally sheet we made for our transportation survey with Mrs. Baxter’s class on page (1). What if we changed each tally mark from a symbol like a bike or car, to a box or square on this special graph paper, and made a new pictograph like on page (2). (Modeling). However, notice the boxes are right next to each other in a Educational Psychology 2-3 row. With all the squares colored in, it’s like a bar going across the page. That’s why it’s called a bar graph. b. However there are some things missing. I‘d like you to discuss it in your group, like a Numbered Heads Together discussion with person #1, #2, #3 & #4 sharing and then coming up with a group decision. Then I’ll use the spinner to call off the number of the person from the group who needs to give me an answer. (Check for Understanding Review) c. (Spinner) Group A- # 2? Group B- #4? Group C- #3? (Etc) d. You really are doing a great job on this, almost all of you got it right, just like the pictograph, labels need to be added. Please add the title of the graph on top, “How we get to school” what’s being sorted on the left, “ transportation” and what’s counted on the bottom.” Number of students” e. What if we had 30 cars instead of 20? What would happen to our graph? (Show of hands – it would get too big for the sheet!) So let’s see how we can reduce it? f. See the line I have drawn on the board? The starting spot ticked at zero and the end ticked at 20. Antonio, please come up and show me where the 2 would go by writing it down, along with the tick mark for counting by 2s. Good job Antonio! Belinda, please come up and do the same for where the 4 would go. That’s great Belinda The rest is easy when we can count by two’s isn’t it class. (choral response) g. Again, just like our pictographs, we would have to reduce the size by skip counting, like we did in our speed drill. However, in a bar graph we don’t Educational Psychology 2-4 need a key. Instead, we will put a scale, something like a ruler, along the bottom with only a tick mark for the missing #s. 4. Modeling - Throughout the lesson model the different tally sheets and sample bar graphs on the overhead. 5. Check for Understanding a. If we were to use this line for the bottom axis, or items counted in our graph, where would the bar stop for the bus amount bar, Deeana? (6) How about the bike bar, Evangeline? (3) Correct! You’re really catching on quickly class! If we look at our rulers and remember our fractions, the 3 is halfway in between the 2 and 4. b. Here is some graph paper, so that you can make up a new graph that represents the same information as before except the bottom line or __________ what class? (Choral response) scale will be skip counted. You will shade each box so that 1 box represents 2 people and only shade in ½ a box for 1 person by dividing the box horizontally like this (model on board). Remember you need to always start the scale at ____________ what class? (Choral response) 0 on the bottom and go across to the right. Don’t forget to put the labels on it. (Review their work at their desks). You’re doing great class I’m really proud of you for paying attention and doing such a great job today. Educational Psychology 2-5 6. Guided Practice 1. Let’s use this tally chart for items sold this with your group members to make on Treasure Island last month, to make a sure you’re doing it correctly. bar a new bar graph. You can discuss I will monitor and give feedback. 2. How many pencils were sold? 22 3. Were many pens were sold? 15 4. Were more pencils or pens sold? Pencil’s 22 > 8 5. How many more markers were sold than folders? 8 – 7 = 1; 1 more marker 6. How many more pens were sold than markers? 15 – 8 = 7; 7 more pens 7. How many items were sold in all? 7 + 22 + 15 + 8 = 52 in all 7. Independent Practice (homework if not finished in class) Remember the fun we had making tally sheets for determining when all the birthdays were for all the c-pod 3rd grade classes. Below, I’ve listed a summary of what we found out. 1. Please make a bar graph with proper labels: Student Birthdays, Seasons, and Number of Students. You won’t need to skip count on this one. Also, don’t forget to combine all the classes before proceeding. a. Mrs. Baxter’s Class i. Fall ii. Winter iii. Spring iv. Summer b. Ms. Smith’s Class i. Fall ii. Winter 4 3 5 4 3 3 iii. Spring iv. Summer c. Mr. Bill’s Class i. Fall ii. Winter iii. Spring iv. Summer 8 6 6 4 3 7 Educational Psychology 2-6 2. Please write five sentences for questions (include a separate answer sheet) that you could get from this bar graph. You will have the other members of your group solve them during our next math lesson. Special note: Here is a sample of a bar graph taken off the Internet 1) Accommodations that I will make in my lesson for learners with special needs have already been planned for when I formed cooperative learning groups near the beginning of the year. a. When I made up the teams, I need to make sure they are evenly balanced, especially with all the special needs students such as English Language Learners. If the same teams lose all the time, it is no longer fun. b. I made sure that the special education needs student and English language learners were close and are also next to a potential “buddy” who could help augment or clarify my instructions if need be. I put together cooperative learning groups with the right mix of students to promote mutual assistance among the members 2) Specific accommodations in this lesson: a. I made sure I took advantage of group strategies and because I have already assigned each student to a specific team, it will be easier to implement. When it’s time to form the groups for tasks such as those in this lesson, Round Robin and Numbered Heads Together, they will be working together for a common goal, they will retain more information, have fun while doing it, and get to know and understand each other better. Educational Psychology 2-7 b. With my students with exceptionalities, I will let them know that they can finish the independent practice at home because it will lower their level of concern or worry about finishing on time, and therefore they will feel more like staying on task when the pressure of completing is lowered. c. Another challenge I was aware of is the fact that many students with learning disabilities often become frustrated and vent that frustration with misbehavior. Therefore, I have used a rapid pace of instruction in my lesson plan to help prevent this type of problem. There are a number of items to go over, but with a positive attitude, I will instill in them to go a step beyond their comfort zone to reach their “cutting edge” of new ideas. d. I praised each group for their input and for paying attention because according to Wong (1998), the cooperative learning groups encourage all students regardless of their ability, disability or ethnic background to work at peak performance. The key is to help the students believe that they are in it together and really care if the other succeeds (p 251 & 256). e. Another reason for cooperative learning in my lesson was because according to Slavin (2003), a critical goal of multicultural education is to help build positive relationships and proper attitudes among students of divergent backgrounds, and in his comments concerning Boykin (1994), that there is evidence that members of certain ethnic groups learn better when using cooperative methods.
