MATH SURVEY AND GRAPHING PROJECT
advertisement

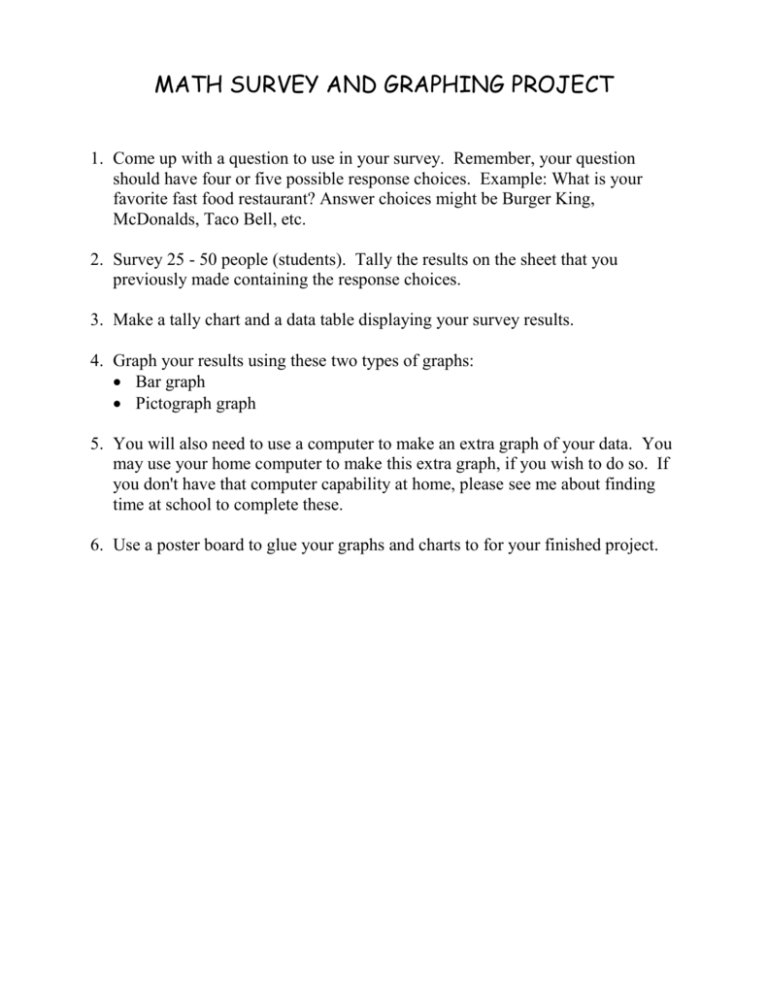
MATH SURVEY AND GRAPHING PROJECT 1. Come up with a question to use in your survey. Remember, your question should have four or five possible response choices. Example: What is your favorite fast food restaurant? Answer choices might be Burger King, McDonalds, Taco Bell, etc. 2. Survey 25 - 50 people (students). Tally the results on the sheet that you previously made containing the response choices. 3. Make a tally chart and a data table displaying your survey results. 4. Graph your results using these two types of graphs: Bar graph Pictograph graph 5. You will also need to use a computer to make an extra graph of your data. You may use your home computer to make this extra graph, if you wish to do so. If you don't have that computer capability at home, please see me about finding time at school to complete these. 6. Use a poster board to glue your graphs and charts to for your finished project. GRADING CRITERIA 1. Graph title—The title is NOT the question. 2. Question—Should be at the top of the tally chart and data table. 3. Graph—Don't forget the title and any sub labels that are required on certain graphs, like bar graphs. 4. Neatness and organization. 5. Turned in on time. Criteria 1 2 3 Title of Graph Graph Title is on Graph Title is appears at the Graph title is not poster but not on on poster on top top in big and found on poster top or letters are but letters are bold letters. sloppily written sloppily written Tally chart is presented and Tally chart and includes tally Tally chart is not tally marks are marks along given evident with stated question Data table number of tallied answers organized Data table is not from greatest present to least and number surveyed at bottom Project includes three graphs; pictograph, bar graph and one created on a computer Poster display includes graphs, data table, and tally chart mounted on poster board, neatly presented, and project is turned in by required date One graph is displayed using data gathered Graphs are placed on poster without backing/project is turned in past due date Points 4 Title of Graph appears on top of poster in big and bold font ____ Tally chart and tally marks are evident, survey question is present ____ Data table is present with number of Data table is tallied answers present and organized from organized in greatest to least some fashion and the number of persons surveyed at the bottom ____ Two graphs are All three graphs Two graphs are displayed in are displayed in displayed using color using data color using data data gathered gathered gathered ____ Data table is present but not organized Display is visually Graphs are Display is attractive mounted on visually includes 3 poster board, attractive and graphs, data display is includes 2 table, tally visually graphs/project chart, survey adequate/project is turned in on question, graph is turned in on due date title/project is due date turned in on due date Total----> ____ ____ A Bar Graph of your information A counted table of your information. A pictograph of your information. A Tally Chart of your information An example of your finished project.


