Supplementary Information (doc 3083K)
advertisement
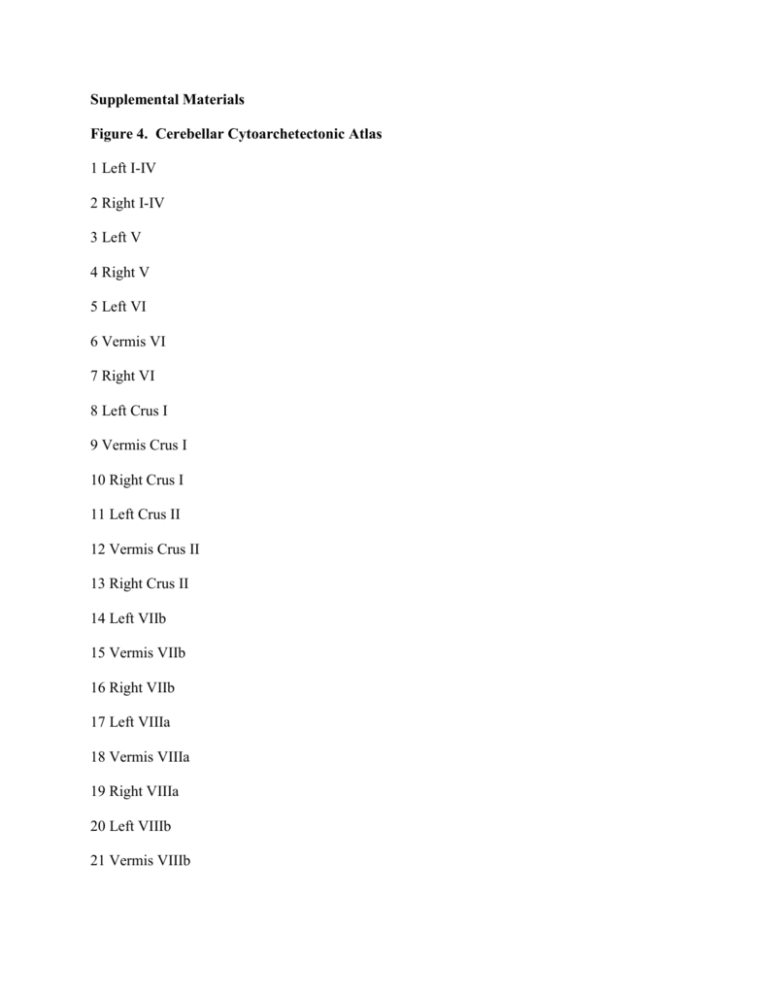
Supplemental Materials Figure 4. Cerebellar Cytoarchetectonic Atlas 1 Left I-IV 2 Right I-IV 3 Left V 4 Right V 5 Left VI 6 Vermis VI 7 Right VI 8 Left Crus I 9 Vermis Crus I 10 Right Crus I 11 Left Crus II 12 Vermis Crus II 13 Right Crus II 14 Left VIIb 15 Vermis VIIb 16 Right VIIb 17 Left VIIIa 18 Vermis VIIIa 19 Right VIIIa 20 Left VIIIb 21 Vermis VIIIb 22 Right VIIIb 23 Left IX 24 Vermis IX 25 Right IX 26 Left X 27 Vermis X 28 Right X Figure 5. Correlations with Duration of Stimulant Treatment – Scatter Plots The figure shows scatter plots demonstrating that the duration of stimulant treatment was positively correlated with regional volumes in the left lobule X (R2= 0.14) (N=18). Figure 6. Correlations with ADHD Symptom Severity – Scatter Plots The figure shows scatter plots demonstrating that current inattention scores on the ADHD rating scale are inversely correlated with the regional volumes in the vermis VIII a and VIII b (R2 = 0.18) and that current hyperactivity scores were inversely correlated with regional volumes in the vermis VIII a (R2 = 0.10)(N=30). Figure 7. Effects of Age on Regional Cerebellar Volumes The figure shows statistical maps in different cerebellum views; the color bar indicates the color coding for p values associated with the main effect of age, ranging from p<0.0001 in red (i.e. increased regional volumes) and p<0.0001 in purple (i.e. decreased regional volumes). The theory of Gaussian Random Fields (GRF) was used to correct for multiple comparisons. Uncorrected maps (Fig 7 A) show that older youth exhibited larger regional volumes across the cerebellum. GRF-corrected maps (Fig 7 B) demonstrate that these associations were not significant after analyses were corrected for multiple comparisons. Figure 8. Effects of Gender on Regional Cerebellar Volumes The figure shows statistical maps in different cerebellum views; the color bar indicates the color coding for p values associated with the main effect of gender, ranging from p<0.0001 in red (i.e. increased regional volumes) and p<0,0001 in purple (i.e. decreased regional volumes). The theory of Gaussian random field was used to correct for multiple comparisons. Uncorrected maps (Fig 8 A) show that male participants exhibited smaller regional volumes across the cerebellum. GRF-corrected maps (Fig 8 B) demonstrate that these associations were not significant after analyses were corrected for multiple comparisons. Figure 9. Comparisons between A. Normal Controls and ADHD Participants on Stimulants; B. Normal Controls and ADHD Participants off Stimulants The figure shows statistical maps in different cerebellum views; the color bar indicates the color coding for p values associated with the main effect of age, ranging from p<0.0001 in red (i.e. increased regional volumes) and p<0,0001 in purple (i.e. decreased regional volumes). The theory of Gaussian Random Field (GRF) was used to correct for multiple comparisons. Uncorrected maps show that: A - youth with ADHD who were receiving stimulants at the time of the scan exhibited significantly larger than controls regional volumes in left lobule X (Fig 9A); B- youth with ADHD who were not receiving stimulants at the time of the scan exhibited significantly smaller regional volumes than controls in left lobules VI, left crus I and left crus II (Fig 9B). Figure 4. Cerebellar Cytoarchetectonic Atlas Coregistered to our Template Cerebellum Figure 5. Correlations with Duration of Stimulant Treatment – Scatter Plots Figure 6. Correlations with ADHD Symptom Severity – Scatter Plots Figure 7 A. Effects of Age on Regional Cerebellar Volumes – Uncorrected Figure 7 B. Effects of Age on Regional Cerebellar Volumes – Corrected Figure 8 A. Effects of Gender on Regional Cerebellar Volumes – Uncorrected Figure 8 B. Effects of Gender on Regional Cerebellar Volumes – Corrected Figure 9.
