AuSSA Data Subset Tutorial Exercise 1:
advertisement
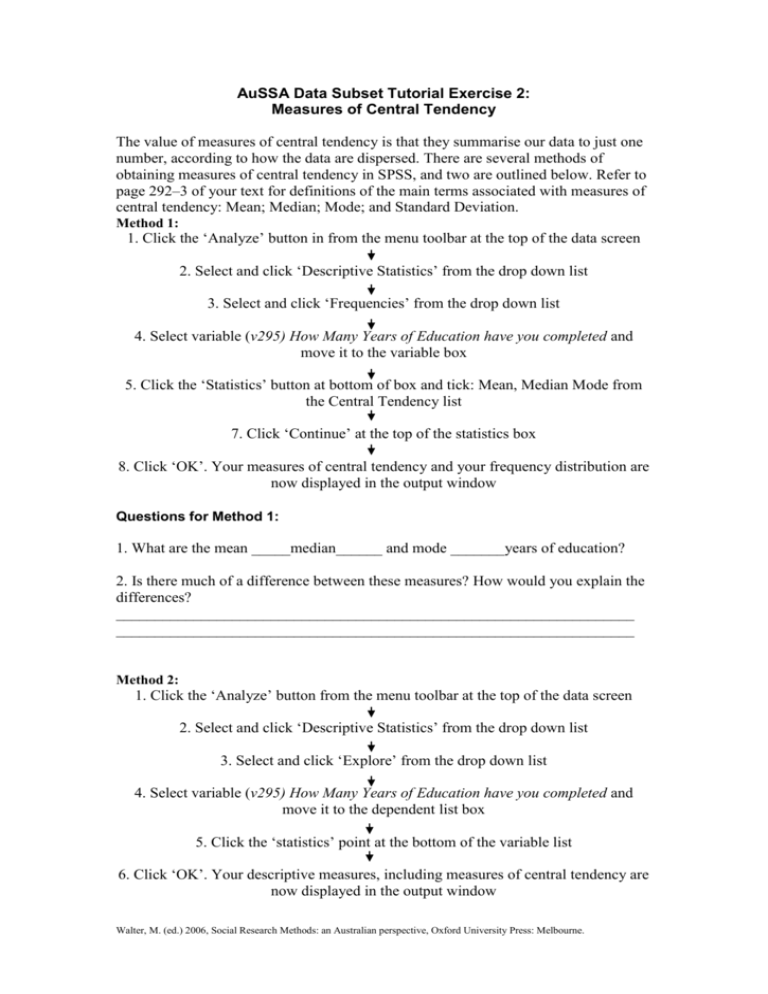
AuSSA Data Subset Tutorial Exercise 2: Measures of Central Tendency The value of measures of central tendency is that they summarise our data to just one number, according to how the data are dispersed. There are several methods of obtaining measures of central tendency in SPSS, and two are outlined below. Refer to page 292–3 of your text for definitions of the main terms associated with measures of central tendency: Mean; Median; Mode; and Standard Deviation. Method 1: 1. Click the ‘Analyze’ button in from the menu toolbar at the top of the data screen 2. Select and click ‘Descriptive Statistics’ from the drop down list 3. Select and click ‘Frequencies’ from the drop down list 4. Select variable (v295) How Many Years of Education have you completed and move it to the variable box 5. Click the ‘Statistics’ button at bottom of box and tick: Mean, Median Mode from the Central Tendency list 7. Click ‘Continue’ at the top of the statistics box 8. Click ‘OK’. Your measures of central tendency and your frequency distribution are now displayed in the output window Questions for Method 1: 1. What are the mean _____median______ and mode _______years of education? 2. Is there much of a difference between these measures? How would you explain the differences? ___________________________________________________________________ ___________________________________________________________________ Method 2: 1. Click the ‘Analyze’ button from the menu toolbar at the top of the data screen 2. Select and click ‘Descriptive Statistics’ from the drop down list 3. Select and click ‘Explore’ from the drop down list 4. Select variable (v295) How Many Years of Education have you completed and move it to the dependent list box 5. Click the ‘statistics’ point at the bottom of the variable list 6. Click ‘OK’. Your descriptive measures, including measures of central tendency are now displayed in the output window Walter, M. (ed.) 2006, Social Research Methods: an Australian perspective, Oxford University Press: Melbourne. Questions for Method 2: 3. What is the difference in the information included in the outputs from Method 1 compared to Method 2? ____________________________________________________________________ ____________________________________________________________________ ____________________________________________________________________ 4. What do you think might be the analysis benefits of each method? ____________________________________________________________________ ____________________________________________________________________ ____________________________________________________________________ 5. Can you explain some of the other descriptive statistics included in the output for the method 2 analysis? ____________________________________________________________________ ____________________________________________________________________ 6. Statistical analysis is not just about generating statistical ‘results’. The important social science research work is how we interpret these results to increase our understanding of social phenomena. So, using these statistics, including the measures of central tendency, write a short paragraph that summarises what the AuSSA data tell us about the level of education among the Australian population. Add to your results (and your interpretation) by also running a frequency distribution (as per exercise 1) on the variable (v296) R: What is the highest level of education you have completed? _____________________________________________________________________ _____________________________________________________________________ _____________________________________________________________________ _____________________________________________________________________ _____________________________________________________________________ _____________________________________________________________________ _____________________________________________________________________ _____________________________________________________________________ _____________________________________________________________________ _____________________________________________________________________ ____________________________________________________________________ Do you think the story about education levels contained within these data would change if we divided our analysis by gender? Note: Measures of central tendency are usually, but not exclusively, used with continuous variables. Continuous variables are those whose categories of response are in a continuous run of numbers format—that is, years of education, age in years, number of children in the household. Walter, M. (ed.) 2006, Social Research Methods: an Australian perspective, Oxford University Press: Melbourne.

