Atomic Spectra lab Notes
advertisement
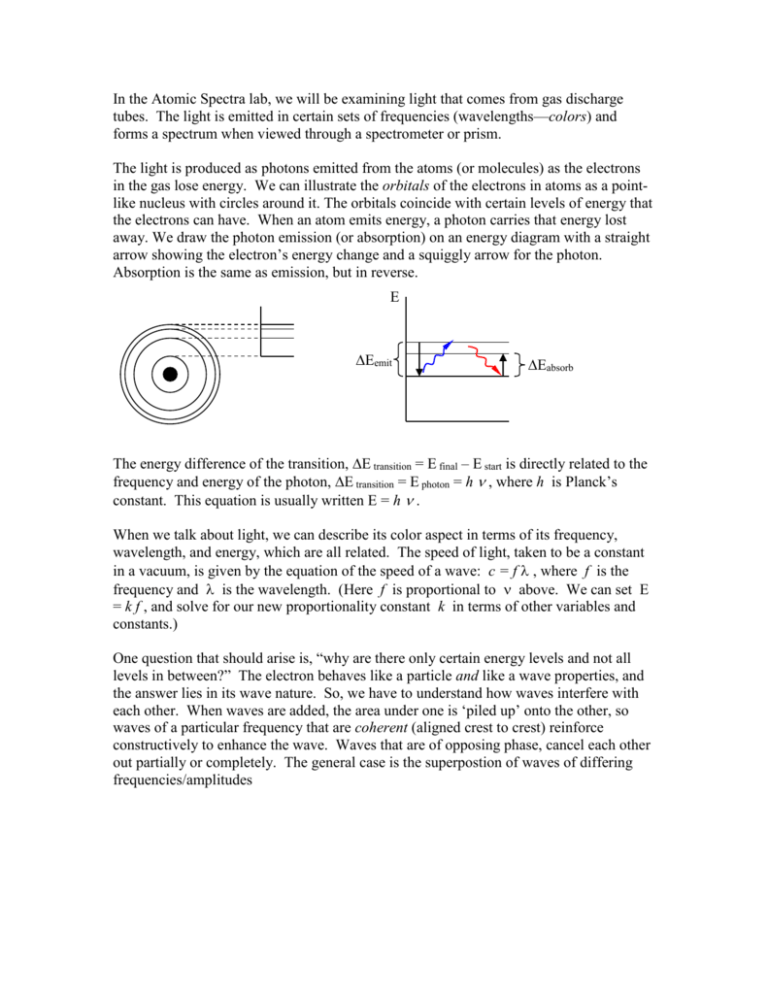
In the Atomic Spectra lab, we will be examining light that comes from gas discharge tubes. The light is emitted in certain sets of frequencies (wavelengths—colors) and forms a spectrum when viewed through a spectrometer or prism. The light is produced as photons emitted from the atoms (or molecules) as the electrons in the gas lose energy. We can illustrate the orbitals of the electrons in atoms as a pointlike nucleus with circles around it. The orbitals coincide with certain levels of energy that the electrons can have. When an atom emits energy, a photon carries that energy lost away. We draw the photon emission (or absorption) on an energy diagram with a straight arrow showing the electron’s energy change and a squiggly arrow for the photon. Absorption is the same as emission, but in reverse. E Eemit Eabsorb The energy difference of the transition, E transition = E final – E start is directly related to the frequency and energy of the photon, E transition = E photon = h , where h is Planck’s constant. This equation is usually written E = h . When we talk about light, we can describe its color aspect in terms of its frequency, wavelength, and energy, which are all related. The speed of light, taken to be a constant in a vacuum, is given by the equation of the speed of a wave: c = f , where f is the frequency and is the wavelength. (Here f is proportional to above. We can set E = k f , and solve for our new proportionality constant k in terms of other variables and constants.) One question that should arise is, “why are there only certain energy levels and not all levels in between?” The electron behaves like a particle and like a wave properties, and the answer lies in its wave nature. So, we have to understand how waves interfere with each other. When waves are added, the area under one is ‘piled up’ onto the other, so waves of a particular frequency that are coherent (aligned crest to crest) reinforce constructively to enhance the wave. Waves that are of opposing phase, cancel each other out partially or completely. The general case is the superpostion of waves of differing frequencies/amplitudes constructive interference destructive interference general case Let’s now take an sine wave representing the wave nature of an electron and ‘wrap’ it around a circle, a flat, two dimesional representation somewhat like the orbitals picture above. The red circle represents zero. In the case where an whole integer number of waves fit around the circle, the wave reinforces itself, but where a whole number of waves does not fit, part of the wave will interfere with itself and cancel. The diagram on the left where 3 wavelength fit around the circle and on the right it shows part of a wave where 3 ½ wavelengths would fit the circle. Extending the wave on the right would show that the parts above the and below the circle would eventually cancel out. The same would be true for any non-integer number of wavelengths. The next number of wavelengths that would fit in the circle without canceling out would be exactly four. This is an analogy for why electrons in atoms can have only certain energies—only ones that ‘fit’. So, the energy of the electron can change only by the certain amounts of photons that it can absorb (increasing it to a higher whole number of wavelengths) or emit (reducing it down to a lower whole number). There are other restrictions too. Of course, the atom is a three dimensional object, so extension to three dimensions would improve the analogy. Follow the links on the main web page to see some threedimensional pictures of orbitals. The next question is what is a spectrum and how do we make one? The rainbow is an example of a spectrum. It is a relatively good example of a continuous spectrum, which has all colors in it. Each emission spectrum from the gas discharge tubes has only some subset of the colors, or frequencies, from the entire rainbow. Our spectrometers have a small diffraction grating inside them and will cause the light from the gas tubes (or any other source) to be arranged into a spectrum. To see how this works, consider light of one wavelenghth passing through a pair of slits. We will take the ‘top’ view so we see the slits in cross section and the waves from ‘above’. The slits are narrow enough so that the light waves fan out. The solid curves represent the wave crests and the dotted curves represent the wave troughs. Constructive interference occurs where the waves coincide crest-to-crest and trough-to-trough, destructive interference where the waves meet crest-to-trough, and at angles in between are varying degrees of constructive and destructive interference. The result is brighter regions where the solid lines meet the screen and darker regions where the faded lines meet the screen, with gradations between. If we add many many uniformly spaced slits (to make it a diffraction grating), then there will be more interference and the bright regions will narrow to become slit-like spectral lines. For different wavelengths of light passing through the slits with the same slit separation, the constructive interference rays propagate at different angles. So, if we shine fullspectrum white light through the diffraction grating, on the screen will be a red line beside a slightly oranger red line, and a slightly more orange line, and so forth, continuing on through both ends of the rainbow.
