Economics Problem Set: Aggregate Demand & Supply
advertisement
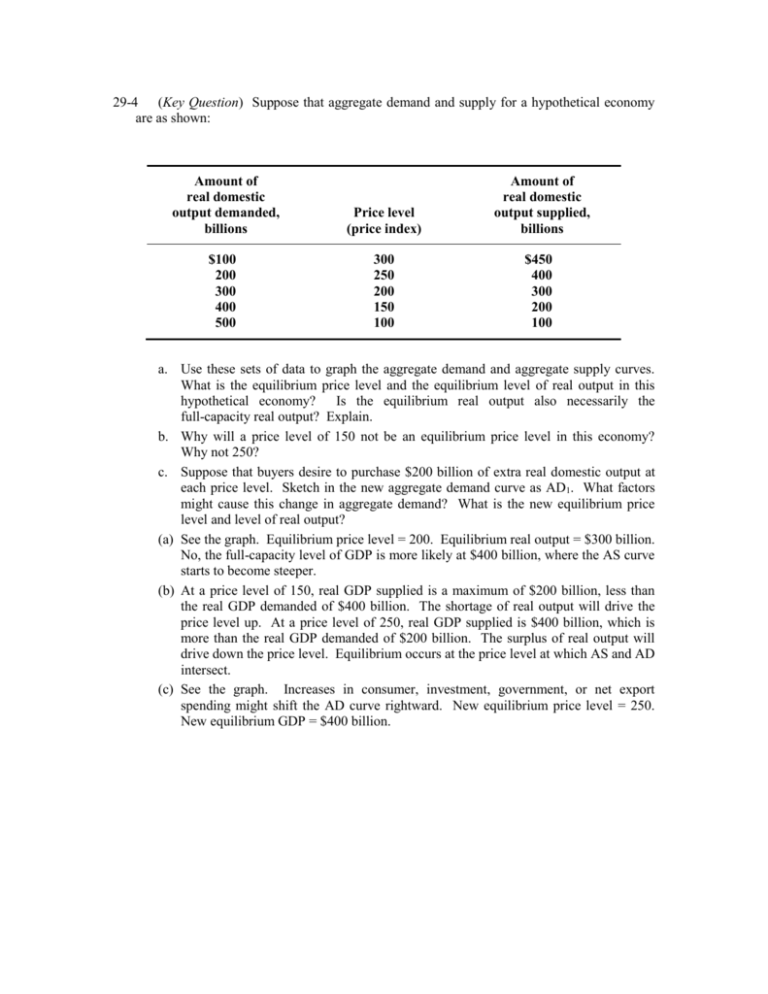
29-4 (Key Question) Suppose that aggregate demand and supply for a hypothetical economy are as shown: Amount of real domestic output demanded, billions Price level (price index) Amount of real domestic output supplied, billions $100 200 300 400 500 300 250 200 150 100 $450 400 300 200 100 a. Use these sets of data to graph the aggregate demand and aggregate supply curves. What is the equilibrium price level and the equilibrium level of real output in this hypothetical economy? Is the equilibrium real output also necessarily the full-capacity real output? Explain. b. Why will a price level of 150 not be an equilibrium price level in this economy? Why not 250? c. Suppose that buyers desire to purchase $200 billion of extra real domestic output at each price level. Sketch in the new aggregate demand curve as AD1. What factors might cause this change in aggregate demand? What is the new equilibrium price level and level of real output? (a) See the graph. Equilibrium price level = 200. Equilibrium real output = $300 billion. No, the full-capacity level of GDP is more likely at $400 billion, where the AS curve starts to become steeper. (b) At a price level of 150, real GDP supplied is a maximum of $200 billion, less than the real GDP demanded of $400 billion. The shortage of real output will drive the price level up. At a price level of 250, real GDP supplied is $400 billion, which is more than the real GDP demanded of $200 billion. The surplus of real output will drive down the price level. Equilibrium occurs at the price level at which AS and AD intersect. (c) See the graph. Increases in consumer, investment, government, or net export spending might shift the AD curve rightward. New equilibrium price level = 250. New equilibrium GDP = $400 billion. 29-5 (Key Question) Suppose that a hypothetical economy has the following relationship between its real output and the input quantities necessary for producing that level of output: Input quantity 150.0 112.5 75.0 Real GDP 400 300 200 a. What is productivity in this economy? b. What is the per-unit cost of production if the price of each input is $2? c. Assume that the input price increases from $2 to $3 with no accompanying change in productivity. What is the new per-unit cost of production? In what direction did the $1 increase in input price push the economy’s aggregate supply curve? What effect would this shift in aggregate supply have upon the price level and the level of real output? d. Suppose that the increase in input price does not occur but instead that productivity increases by 100 percent. What would be the new per-unit cost of production? What effect would this change in per unit production cost have on the aggregate supply curve? What effect would this shift in aggregate supply have on the price level and the level of real output? 29-6 (a) Productivity = 2.67 (= 400/150; = 300/112.5; = 200/75.0) (b) Per-unit cost of production = $.75 (= $2 x 112.5/300) (c) New per-unit production cost = $1.13 (= $3 x 75/200). The AS curve would shift leftward. The price level would rise and real output would decrease. (d) New per-unit cost of production = $0.375 (= $2 x 112.5/600). AS curve shifts to the right; price level declines and real output increases. (Key Question) What effects would each of the following have on aggregate demand or aggregate supply? In each case use a diagram to show the expected effects on the 29-7 equilibrium price level and level of real output. Assume that all other things remain constant. a. A widespread fear of depression on the part of consumers. b. A $2 increase in the excise tax on a pack of cigarettes. c. A reduction in interest rates at each price level. d. A major increase in Federal spending for health care. e. The expectation of rapid inflation. f. The complete disintegration of OPEC, causing oil prices to fall by one-half. g. A 10 percent reduction in personal income tax rates. h. A sizable increase in labor productivity (with no change in nominal wages). i. A 12 percent increase in nominal wages (with no change in productivity). j. Depreciation in the international value of the dollar. (a) AD curve left, output down and price level down (assuming no ratchet effect). (b) AS curve left, output down and price level up. (c) AD curve right, output and price level up. (d) AD curve right, output and price level up (any real improvements in health care resulting from the spending would eventually increase productivity and shift AS right). (e) AD curve right, output and price level up. (f) AS curve right, output up and price level down. (g) AD curve right, output and price level up. (h) AS curve right, output up and price level down. (i) AS curve left, output down and price level up. (j) AD curve right (increased net exports); AS curve left (higher input prices) (Key Question) Assume that (a) the price level is flexible upward but not downward and (b) the economy is currently operating at its full-employment output. Other things equal, how will each of the following affect the equilibrium price level and equilibrium level of real output in the short run? a. An increase in aggregate demand. b. A decrease in aggregate supply, with no change in aggregate demand. c. Equal increases in aggregate demand and aggregate supply. d. A decrease in aggregate demand. e. An increase in aggregate demand that exceeds an increase in aggregate supply. (a) Price level rises rapidly and little change in real output. (b) Price level rises and real output decreases. (c) Price level does not change, but real output increases. (d) Price level does not change, but real output declines. (e) Price level increases somewhat, as does real output.


