demonstration guide
advertisement

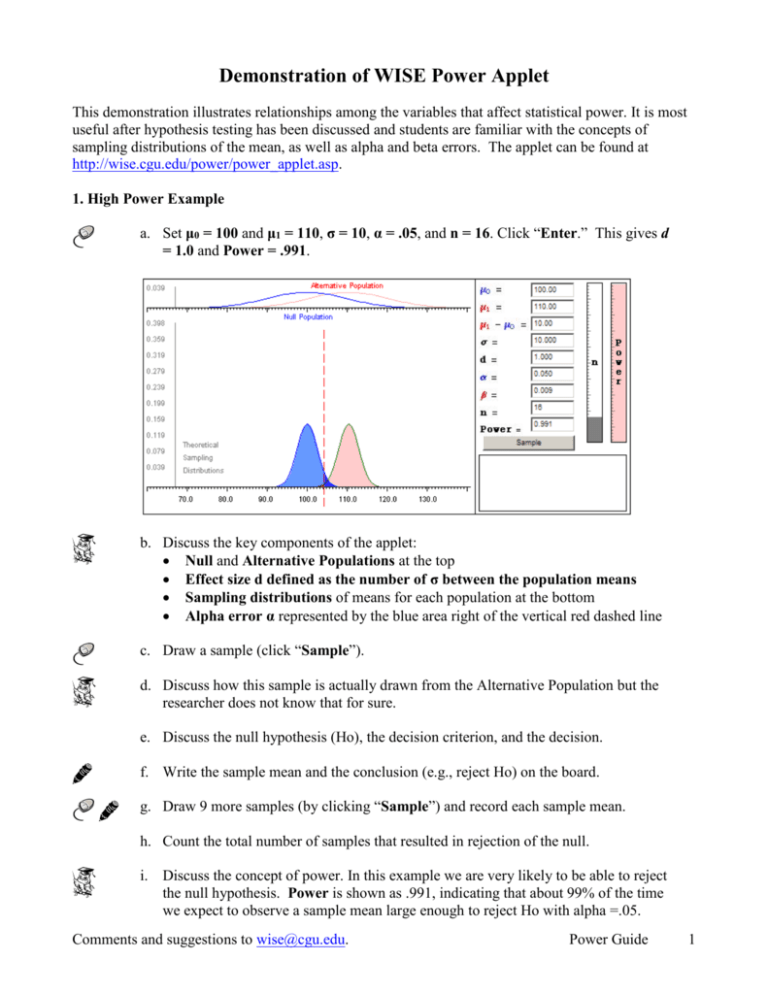
Demonstration of WISE Power Applet This demonstration illustrates relationships among the variables that affect statistical power. It is most useful after hypothesis testing has been discussed and students are familiar with the concepts of sampling distributions of the mean, as well as alpha and beta errors. The applet can be found at http://wise.cgu.edu/power/power_applet.asp. 1. High Power Example a. Set μ0 = 100 and μ1 = 110, σ = 10, α = .05, and n = 16. Click “Enter.” This gives d = 1.0 and Power = .991. b. Discuss the key components of the applet: Null and Alternative Populations at the top Effect size d defined as the number of σ between the population means Sampling distributions of means for each population at the bottom Alpha error α represented by the blue area right of the vertical red dashed line c. Draw a sample (click “Sample”). d. Discuss how this sample is actually drawn from the Alternative Population but the researcher does not know that for sure. e. Discuss the null hypothesis (Ho), the decision criterion, and the decision. f. Write the sample mean and the conclusion (e.g., reject Ho) on the board. g. Draw 9 more samples (by clicking “Sample”) and record each sample mean. h. Count the total number of samples that resulted in rejection of the null. i. Discuss the concept of power. In this example we are very likely to be able to reject the null hypothesis. Power is shown as .991, indicating that about 99% of the time we expect to observe a sample mean large enough to reject Ho with alpha =.05. Comments and suggestions to wise@cgu.edu. Power Guide 1 Power corresponds to the pink area under the alternative population’s sampling distribution of the mean. j. Point out the Power thermometer that shows power nearly 100%. k. Ask: What is beta error? (1.000 - .991 = .009) Show that beta error (probability of failure to reject the false Ho), β, is very small. 2. Low Power Example a. Change μ1 to 102, leaving other settings unchanged. This gives d = 0.2 and Power of about .20. b. Discuss what has changed and what has remained the same in the applet: Null and Alternative Populations overlap more Sampling distributions for each population also overlap more Alpha error is still 5% Power is much lower (about .199 now) c. Draw a sample (click “Sample”). d. Write the sample mean and the conclusion (e.g., reject Ho) on the board. e. Draw 9 more samples (by clicking “Sample”) and record each sample mean. f. Count the total number of samples that resulted in rejection of the null. g. Discuss the power – in this example we often are not able to reject the null hypothesis. Power is shown as .199, indicating that about 20% of the time we expect to observe a sample mean large enough to reject Ho with alpha = .05. h. Point out the Power thermometer, showing power at about 20%. i. Ask: What is beta error? [(100% – 20%) = 80%] Failure to reject Ho is quite Comments and suggestions to wise@cgu.edu. Power Guide 2 likely. j. Note that failing to reject Ho does not imply that Ho is true. 3. Impact of effect size a. Show how power increases as the effect size increases. “Drag” the Alternative Population to the right, showing how power = 1.00 when the entire alternative distribution is above the criterion (all pink). b. When the two distributions overlap exactly, power is equal to alpha error. c. When the alternative distribution is below the null distribution, power is less than alpha. 4. Impact of sample size a. Set μ0 = 100 and μ1 = 105, σ = 10, α = .05, and n = 16. Click “Enter.” This gives d = .5 and Power = .639. b. Ask students to anticipate how the picture will change if the sample size is changed from 16 to 50. (With larger n, the sampling distributions have smaller variance.) c. Make the change (n=50) and discuss. d. “Drag" the Sample thermometer (the gray bar labeled “n”) up and down to show how sample size impacts power by changing the variance of the sampling distributions. e. Note how alpha error remains unchanged at whatever we set it to be. f. Ask: What is power when n = 4? (26%) What is beta error? (74%) Comments and suggestions to wise@cgu.edu. Power Guide 3 5. Impact of standard deviation a. Go back to the high power settings of μ0 = 100 and μ1 = 110, σ = 10, α = .05, and n = 16 (same as in Step 1a). Note that Power is about 99%. b. Ask what will happen if σ = 20 instead of 10. c. Make the change and discuss. NOTE: The scaling in the figure changes automatically, so the change in the shape of the sampling distributions is not as apparent as it would be if we retained the same scale. You may wish to illustrate this on the board. d. Ask what will happen if σ = 50. Set σ = 50 to illustrate even greater loss of power. 6. Impact of alpha a. Set μ0 = 100 and μ1 = 105, σ = 10, α = .05, and n = 16. Click “Enter.” This gives d = .5 and Power of about .64 (β = .36). (These settings are the same as in Step 4a). b. Ask what will happen to power if alpha is reduced from .05 to .01. Make the switch to α. Power drops to about .37 (β = .63). c. Discuss how we have reduced alpha error but at the cost of increasing beta error. 7. Summarize and integrate Discuss how these five concepts are interconnected. If we know any four, we can compute the fifth. To remember the five concepts, think of the mnemonic BEANS: B = Beta error which also gives us power (Power = 1 – Beta) E = Effect size (difference between the means, larger effect gives greater power) A = Alpha error (smaller alpha gives larger beta error and smaller power) N = Sample size (larger sample size gives greater power) S = Standard deviation (greater standard deviation gives less power) Comments and suggestions to wise@cgu.edu. Power Guide 4


