1 Inequalities
advertisement
UNIT 1: WARM-UP AND REVIEW
C. INEQUALITIES
1.
Notation
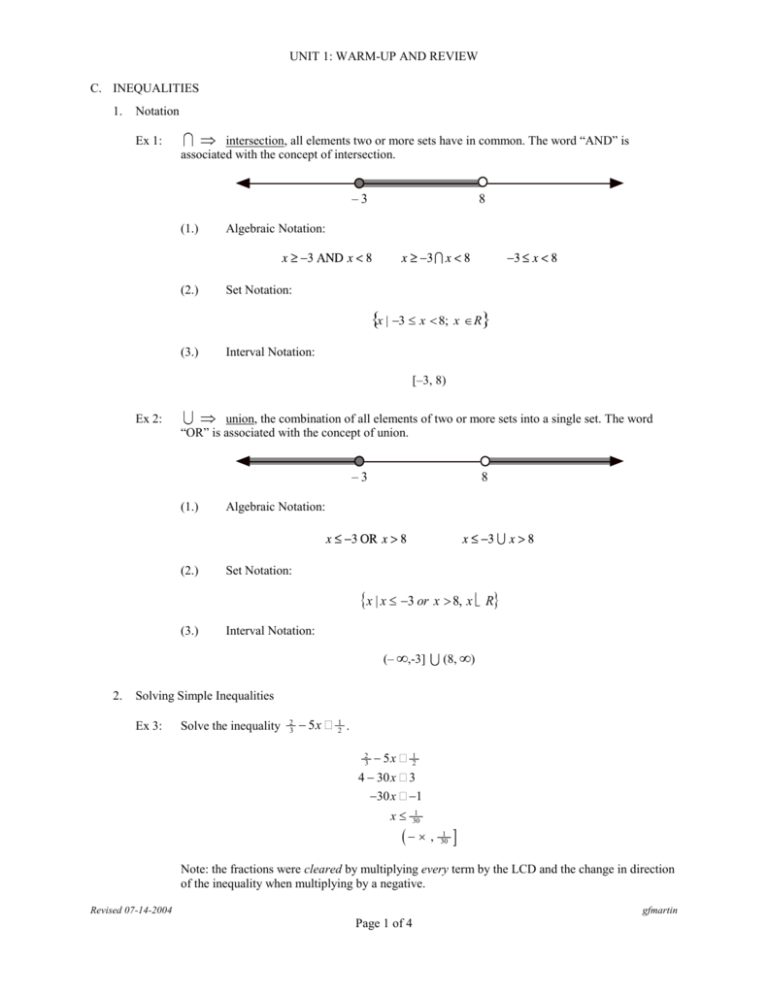
Ex 1:
intersection, all elements two or more sets have in common. The word “AND” is
associated with the concept of intersection.
–3
(1.)
Algebraic Notation:
(2.)
Set Notation:
8
x | 3 x 8; x R
(3.)
Interval Notation:
[–3, 8)
Ex 2:
union, the combination of all elements of two or more sets into a single set. The word
“OR” is associated with the concept of union.
–3
(1.)
Algebraic Notation:
(2.)
Set Notation:
8
{x | x £ -3 or x > 8, x ÎR}
(3.)
Interval Notation:
(– ,-3]
2.
(8, )
Solving Simple Inequalities
Ex 3:
Solve the inequality
2
3
- 5x ³
1
2
.
2
3
- 5x ³
1
2
4 - 30x ³ 3
-30x ³ -1
x£
1
30
(- ¥ ,
1
30
]
Note: the fractions were cleared by multiplying every term by the LCD and the change in direction
of the inequality when multiplying by a negative.
Revised 07-14-2004
gfmartin
Page 1 of 4
UNIT 1: WARM-UP AND REVIEW
Ex 4:
3.
Solve the compound inequality 6x - 3 £ x + 7 < 2x +11.
(1.)
Split the compound inequality into two distinct inequalities. You want all values of x that
will make each inequality true simultaneously. Therefore you are trying to find the
intersection (what they have in common) of the two inequalities.
(2.)
Solve each inequality separately.
(3.)
Find the intersection of the two solutions (what values of x they have in common).
Solving Inequalities Using a Sign Plot
Ex 5:
A sign plot is a method of graphically depicting if a variable expression is positive or negative. To
create a sign plot you must first determine where the variable expression is zero. Once you know
where the expression is zero, then it stands to reason that in the remaining intervals the expression
is positive or negative. To determine if the expression is positive or negative in an interval all that
is required is to choose a value for the variable in the interval and test it in the expression. The
result will either be + or –. Below is a sign plot for the variable expression 3 – x.
–
+
3- x
3
The sign plot informs you that the variable expression has a value of zero at x = 3, that for all
values of x > 3 the variable expression will be a negative real number and for all values of x< 3 the
variable expression will be a positive real number.
Ex 6:
Solve the rational inequality
2x - 3 1
£ .
x+2
3
In order to use a sign plot you must create a variable expression that you can compare to zero.
This requires that you create one single rational expression compared to zero. (Note: A common
mistake is to multiply both sides by the common denominator.) To obtain a solution requires the
use of the CSI method (C = compare to zero and simplify, S = Sign Plot and I = Interval Solution).
Revised 07-14-2004
gfmartin
Page 2 of 4
UNIT 1: WARM-UP AND REVIEW
(1.)
Compare to zero and simplify:
2x - 3 1
£
x+2
3
2x - 3 1
- £0
x+2
3
2x - 3
x+2
æ 3ö 1
×ç ÷ è 3ø 3
æ x+2 ö
×ç
£0
è x + 2 ÷ø
3(2x - 3) - 1(x + 2)
£0
3(x + 2)
6x - 9 - x - 2
£0
3(x + 2)
5x - 11
£0
3(x + 2)
(2.)
Create a sign plot for the variable expression
5x - 11
:
3(x + 2)
Because your variable expression is a fraction, x cannot be a number that will make the
denominator zero (undefined). So you will find where the variable expression is zero and
undefined. Remember a fraction is zero when the numerator is zero.
Zero when x =
11
and undefined when x = -2
5
–
+
+
11
–2
5x - 11
3(x + 2)
5
By picking a value for x in each of the three intervals and evaluating in the variable
5x - 11
expression
you can determine if the expression is + or – in the interval.
3(x + 2)
(3.)
Interval Solution
Now refer back to step (1.). Note we want the variable expression to be equal to zero or less
than zero. By looking at our sign plot we can see where the variable expression is zero and
negative (less than zero).
Revised 07-14-2004
gfmartin
Page 3 of 4
UNIT 1: WARM-UP AND REVIEW
Ex 7:
Solve the quadratic inequality x 2 > x +12 .
(1.)
Compare to zero and simplify (factor)
x 2 > x + 12
x 2 - x -12 > 0
(x - 4)(x + 3) > 0
(2.)
Create the sign plot.
–
+
–3
+
(x - 4)(x + 3)
4
On the sign plot locate the interval(s) where the variable expression (x - 4)(x + 3)is
positive.
x 3 or x 4
(, 3) (4, )
4.
Solving Inequalities using a Graphing Calculator
Ex 8:
Use a graphing calculator to solve Ex 3 through Ex 7 by following these steps:
(1.)
Set the expression equal to zero (compare to zero). All terms on one side(left side), zero on
the opposite side(right side). The result should be variable expression = 0.
(2.)
Graph the variable expression by inputting the equation y = variable expression..
(3.)
If your variable expression was greater than zero, choose the part of the graph above the xaxis as your answer. and if you expression was less than zero, choose the part of the graph
below the x-axis. Use the root command to find where it crosses the x-axis.
Revised 07-14-2004
gfmartin
Page 4 of 4
