gcse-grade-descriptors
advertisement
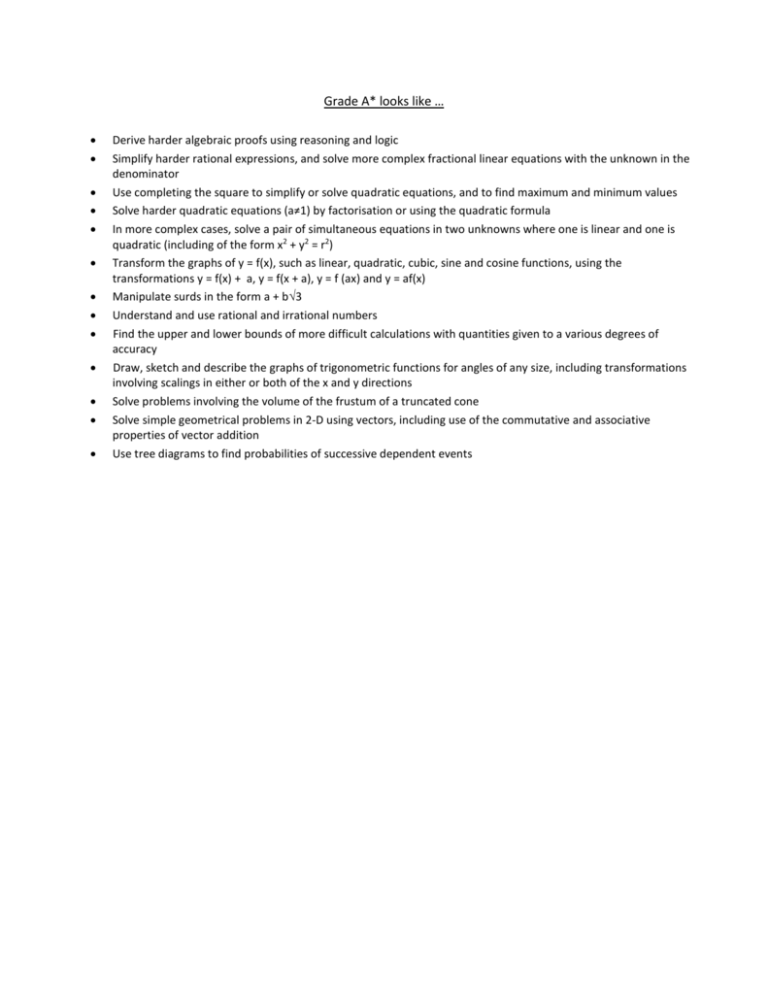
Grade A* looks like … Derive harder algebraic proofs using reasoning and logic Simplify harder rational expressions, and solve more complex fractional linear equations with the unknown in the denominator Use completing the square to simplify or solve quadratic equations, and to find maximum and minimum values Solve harder quadratic equations (a≠1) by factorisation or using the quadratic formula In more complex cases, solve a pair of simultaneous equations in two unknowns where one is linear and one is quadratic (including of the form x2 + y2 = r2) Transform the graphs of y = f(x), such as linear, quadratic, cubic, sine and cosine functions, using the transformations y = f(x) + a, y = f(x + a), y = f (ax) and y = af(x) Manipulate surds in the form a + b3 Understand and use rational and irrational numbers Find the upper and lower bounds of more difficult calculations with quantities given to a various degrees of accuracy Draw, sketch and describe the graphs of trigonometric functions for angles of any size, including transformations involving scalings in either or both of the x and y directions Solve problems involving the volume of the frustum of a truncated cone Solve simple geometrical problems in 2-D using vectors, including use of the commutative and associative properties of vector addition Use tree diagrams to find probabilities of successive dependent events Grade A looks like … Use a wide range of mathematical techniques, terminology, diagrams and symbols consistently, appropriately and accurately Use different representations effectively and recognise equivalent representations Demonstrate sound numerical skills and algebraic fluency; use a calculator effectively Use trigonometry and geometrical properties to solve problems Identify and use mathematics accurately in a range of contexts; choose methods of mathematical communication appropriate to the context Evaluate the appropriateness, effectiveness and efficiency of different approaches; state the limitations of an approach or the accuracy of results and use this information to inform conclusions within a mathematical or statistical problem. Make and test hypotheses and conjectures Adopt appropriate strategies to tackle problems (including those that are novel or unfamiliar), adjusting the approach when necessary Tackle problems that bring together different aspects of mathematics and may involve multiple variables. Identify some variables and investigate them systematically; the outcomes of which are used in solving the problem. Solve quadratic equations (a=1) by factorisation or using the quadratic formula In simple cases, solve a pair of simultaneous equations in two unknowns where one is linear and one is quadratic (including of the form x2 + y2 = r2) Derive and use more complex formulae and change the subject of a formula, including cases where the subject occurs twice Know and understand that the intersection points of the graphs of a linear and quadratic function are the approximate solutions to the corresponding simultaneous equations Manipulate simple surds Determine the bounds of intervals Understand and use direct and inverse proportion Understand and use SSS, SAS, ASA and RHS conditions to prove the congruence of triangles using formal arguments, and to verify standard ruler and compass constructions Understand and use Pythagoras’ theorem to solve 3-D problems Draw, sketch and describe the graphs of trigonometric functions for angles of any size Solve problems involving surface areas and volumes of cylinders, pyramids, cones and spheres Understand and use the formulae for the length of a circular arc and area and perimeter of a sector Understand the difference between formulae for perimeter, area and volume by considering dimensions Select and justify a sampling scheme and a method to investigate a population Use, interpret and compare histograms, including those with unequal class intervals Recognise when and how to work with probabilities associated with independent and mutually exclusive events Grade B looks like … Select and combine known facts and problem solving strategies to solve geometrical problems of increasing complexity Consider possible approaches to exploring a question or testing a hypothesis; refine methods as enquiry progresses Factorise quadratic expressions including the difference of two squares Solve inequalities in two variables and find the solution set Derive and use more complex formulae and change the subject of a formula including cases where a power of the subject appears in the question or solution Identify and sketch graphs of linear and simple quadratic and cubic functions Understand the effect on the graph of addition of (or multiplication by) a constant Understand the equivalence between recurring decimals and fractions Understand and use efficient methods to add, subtract, multiply and divide fractions, interpreting division as a multiplicative inverse Use a multiplier raised to a power to represent and solve problems involving repeated proportional change, e.g. compound interest Calculate with standard index form, using a calculator as appropriate Know, and use, that if two 2-D shapes are similar, corresponding angles are equal and corresponding sides are in the same ratio Understand and use trigonometrical relationships in right-angled triangles, and use these to solve problems, including those involving bearings Estimate and find the median, quartiles and interquartile range for large data sets, including using a cumulative frequency diagram Compare two or more distributions and make inferences, using the shape of the distributions and measures of average and spread including median and quartiles Know when to add or multiply two probabilities: if A and B are mutually exclusive, then the probability of A or B occurring is P(A) + P(B), whereas if A and B are independent events, the probability of A and B occurring is P(A) × P(B) Use tree diagrams to calculate probabilities of combinations of independent events Grade C looks like … Use a range of mathematical techniques, terminology, diagrams & symbols consistently, appropriately and accurately Use different representations effectively and recognise some equivalent representations Demonstrate sound numerical skills and use a calculator effectively Apply ideas of proportionality to numerical problems & use geometric properties of angles, lines & shapes Identify relevant information, select appropriate representations and apply appropriate methods and knowledge. Use different methods of mathematical communication. Understand the limitations of evidence and sampling, and the difference between a mathematical argument and conclusions based on experimental evidence Identify evidence that supports or refutes conjectures and hypotheses Construct a mathematical argument & identify inconsistencies in a given argument or exceptions to a generalisation Tackle problems that bring aspects of mathematics together; identify strategies to solve problems involving a limited number of variables; communicate the chosen strategy, making changes as necessary Construct and solve linear equations with integer coefficients (with and without brackets, negative signs anywhere in the equation, positive or negative solution), using an appropriate method Square a linear expression, expand the product of two linear expressions of the form x ± n and simplify the corresponding quadratic expression Solve a pair of simultaneous linear equations by eliminating one variable; link a graphical representation of an equation or pair of equations to the algebraic solution Solve linear inequalities in one variable, and represent the solution set on a number line Use formulae from mathematics and other subjects; substitute numbers into expressions and formulae; derive a formula and, in simple cases, change its subject Find the next term and the nth term of quadratic sequences and functions and explore their properties Plot graphs of simple quadratic and cubic functions Understand and use proportional changes expressed as fractions, decimals, percentages and ratios Use the equivalence of fractions, decimals and percentages to compare proportions Calculate percentages and find the outcome of a given percentage increase or decrease Use proportional reasoning to solve a problem, choosing the correct numbers to take as 100%, or as a whole Estimate calculations by rounding to one significant figure and multiplying and dividing mentally Understand the effects of multiplying and dividing by numbers between 0 and 1 Use calculators efficiently and appropriately to perform complex calculations with numbers of any size, knowing not to round during intermediate steps of a calculation Solve problems using properties of angles, of parallel and intersecting lines, and of triangles and other polygons, justifying inferences and explaining reasoning with diagrams and text Deduce and use formulae for the area of a triangle, parallelogram and trapezium; calculate areas of compound shapes made from rectangles and triangles Solve problems involving the area and circumference of a circle Understand and apply Pythagoras’ theorem when solving problems in 2-D Solve problems involving surface areas and volumes of right prisms Enlarge 2-D shapes, given a centre of enlargement and a whole-number scale factor, on paper and using ICT; extend to enlarging 2-D shapes, given a fractional scale factor; recognise the similarity of the resulting shapes Recognise that measurements given to the nearest whole unit may be inaccurate by up to one half of the unit in either direction Understand & use measures of speed (and other compound measures such as density or pressures) to solve problems Suggest a problem to explore using statistical methods, frame questions and raise conjectures Design a survey or experiment to capture the necessary data from one or more sources; determine the sample size and degree of accuracy needed Select, construct and modify, on paper and using ICT, suitable graphical representation to progress an enquiry, including frequency diagrams and scatter graphs to develop further understanding of correlation Estimate the mean, median and range of a set of grouped data and determine the modal class Compare two or more distributions and make inferences, using the shape of the distributions and measures of average and range Understand relative frequency as an estimate of probability and use this to compare outcomes of an experiment Grade D looks like … Solve problems and carry through substantial tasks by breaking them into smaller, more manageable tasks, using a range of efficient techniques, methods and resources, including ICT; give solutions to an appropriate degree of accuracy Interpret, discuss and synthesise information presented in a variety of mathematical forms Use logical argument to establish the truth of a statement Use systematic trial and improvement methods and ICT tools to find approximate solutions to equations such as x3 + x = 20 Generate terms of a sequence using term-to-term and position-to-term definitions of the sequence, on paper and using ICT Plot the graphs of linear functions, where y is given explicitly in terms of x; recognise that equations of the form y = mx + c correspond to straight-line graphs Construct functions arising from real-life problems and plot their corresponding graphs; interpret graphs arising from real situations Use the terms square, positive and negative square root, cube and cube root Recall integer squares from 2×2 to 15×15 and the corresponding square roots Divide a quantity into two or more parts in a given ratio and solve problems involving ratio and direct proportion Add and subtract fractions by writing them with a common denominator, calculate fractions of quantities (fraction answers); multiply and divide an integer by a fraction Classify quadrilaterals by their geometric properties Identify alternate and corresponding angles: understand a proof that the sum of the angles of a triangle is 180° and of a quadrilateral is 360° Devise instructions for a computer to generate and transform shapes and paths Visualise and use 2-D representations of 3-D objects Know that translations, rotations and reflections preserve length and angle and map objects onto congruent images Use straight edge and compasses to do standard constructions Deduce and use formulae for the volume of a cuboid; calculate volumes and surface areas of cuboids Design, trial and if necessary refine data collection sheets; construct tables for large discrete and continuous sets of raw data, choosing suitable class intervals; design and use two-way tables Select, construct and modify, on paper and using ICT: - pie charts for categorical data; - bar charts and frequency diagrams for discrete and continuous data; - simple time graphs for time series; - scatter graphs. Identify which are most useful in the context of the problem. Find and record all possible mutually exclusive outcomes for single events and two successive events in a systematic way Know that the sum of probabilities of all mutually exclusive outcomes is 1 and use this when solving problems Communicate interpretations and results of a statistical survey using selected tables, graphs and diagrams in support Grade E looks like … Solve word problems and investigations from a range of contexts Break a complex calculation into simpler steps, choosing and using appropriate and efficient operations and methods Simplify or transform linear expressions by collecting like terms Multiply a single term over a bracket Plot the graphs of simple linear functions Round decimals to the nearest decimal place; round a number to one significant figure Order negative numbers in context Recognise and use number patterns and relationships Use equivalence between fractions and order fractions and decimals Understand simple ratio Extend mental methods of calculation to include decimals, fractions and percentages Add, subtract, multiply and divide integers Use function keys on a calculator for powers and roots Find one number as a fraction of another Use a wider range of properties of 2-D and 3-D shapes Reason about position and movement and transform shapes Read and interpret scales on a range of measuring instruments, explaining what each labelled division represents Ask questions, plan how to answer them and collect the data required Create and interpret line graphs where the intermediate values have meaning Construct and interpret stem-and-leaf diagrams Estimate probabilities from experimental data; understand that: - if an experiment is repeated there may be, and usually will be, different outcomes; - increasing the number of times an experiment is repeated generally leads to better estimates of probability. Grade F looks like … Use some mathematical techniques, terminology, diagrams and symbols from the foundation tier consistently, appropriately and accurately Use some different representations effectively and select information from them Complete straightforward calculations competently with and without a calculator Use simple fractions and percentages, simple formulae and some geometric properties, including symmetry Work mathematically in everyday and meaningful contexts; make use of diagrams and symbols to communicate mathematical ideas. Check the accuracy and reasonableness of results on occasions Test simple hypotheses and conjectures based on evidence; use data to look for patterns and relationships State a generalisation arising from a set of results and identify a counter-example Solve simple problems, some of which are non-routine Construct, express in symbolic form, and use simple formulae involving one or two operations Use coordinates in all four quadrants to locate and specify points Explore and describe number patterns and relationships including multiple, factor and square Use understanding of place value to multiply and divide whole numbers and decimals by 10, 100 and 1000 Reduce a fraction to its simplest form by cancelling common factors Order, add and subtract negative numbers in context Use all four operations with decimals to two places Solve simple problems involving ratio and direct proportion Calculate fractional or percentage parts of quantities and measurements, using a calculator where necessary Understand and use an appropriate non-calculator method for solving problems involving multiplying and dividing any three-digit by any two-digit number Check the reasonableness of results by reference to knowledge of the context or to the size of the numbers, by applying inverse operations or by estimating using approximations Measure and draw angles to the nearest degree, when constructing models and drawing or using shapes Use language associated with angle and know and use the angle sum of a triangle and that of angles at a point Identify all the symmetries of 2-D shapes Solve problems involving the conversion of units and make sensible estimates of a range of measures in relation to everyday situations Understand and use the formula for the area of a rectangle and distinguish area from perimeter Understand and use the mean of discrete data and compare two simple distributions, using the range and one of mode, median or mean Interpret graphs and diagrams, including pie charts, and draw conclusions Understand and use the probability scale from 0 to 1 In probability, select methods based on equally likely outcomes and experimental evidence, as appropriate Understand that different outcomes may result from repeating an experiment Grade G looks like … Use and interpret mathematical symbols and diagrams Understand a general statement by finding particular examples that match it Review their work and reasoning Develop and use their own strategies within mathematics and in applying mathematics to practical contexts Present information and results in a clear and organised way Search for a solution by trying out ideas of their own Recognise a wider range of sequences Begin to use simple formulae expressed in words Use and interpret coordinates in the first quadrant Understand place value in numbers to 1000; use place value to make approximations Recognise negative numbers in contexts such as temperature Begin to use decimal notation in contexts such as money Recognise approximate proportions of a whole and use simple fractions and percentages to describe these Order decimals to three decimal places Use a range of mental methods of computation with all operations; including use of recall of addition and subtraction facts to 20 Use efficient written methods of addition and subtraction and of short multiplication and division; including multiplication and division of two digit numbers by 2, 3, 4 or 5 as well as 10 with whole number answers and remainders Recall multiplication facts up to 10 × 10 and quickly derive corresponding division facts Solve problems with or without a calculator Classify 3-D and 2-D shapes in various ways using mathematical properties such as reflective symmetry for 2-D shapes Begin to recognise nets of familiar 3-D shapes, e.g. cube, cuboid, triangular prism, square-based pyramid Use standard units of time Make 3-D models by linking given faces or edges and draw common 2-D shapes in different orientations on grids Find perimeters of simple shapes and find areas by counting squares Collect and record discrete data Group data, where appropriate, in equal class intervals Use Venn and Carroll diagrams to record their sorting and classifying of information Construct and interpret frequency diagrams, simple line graphs and pictograms, where the symbol represents a group of units Understand and use the mode and range to describe sets of data
