Math Mini-Lab: Graph of Quadratic Equations
advertisement
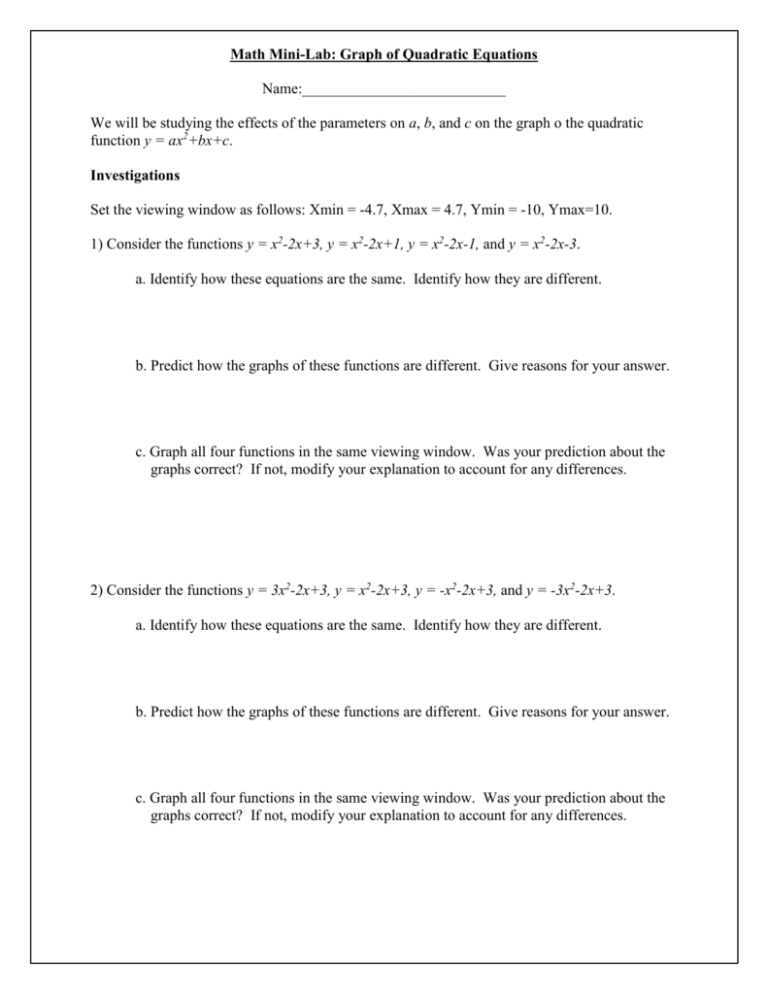
Math Mini-Lab: Graph of Quadratic Equations Name:___________________________ We will be studying the effects of the parameters on a, b, and c on the graph o the quadratic function y = ax2+bx+c. Investigations Set the viewing window as follows: Xmin = -4.7, Xmax = 4.7, Ymin = -10, Ymax=10. 1) Consider the functions y = x2-2x+3, y = x2-2x+1, y = x2-2x-1, and y = x2-2x-3. a. Identify how these equations are the same. Identify how they are different. b. Predict how the graphs of these functions are different. Give reasons for your answer. c. Graph all four functions in the same viewing window. Was your prediction about the graphs correct? If not, modify your explanation to account for any differences. 2) Consider the functions y = 3x2-2x+3, y = x2-2x+3, y = -x2-2x+3, and y = -3x2-2x+3. a. Identify how these equations are the same. Identify how they are different. b. Predict how the graphs of these functions are different. Give reasons for your answer. c. Graph all four functions in the same viewing window. Was your prediction about the graphs correct? If not, modify your explanation to account for any differences. 3) Consider the functions y = x2-4x+3, y = x2-2x+3, y = x2+2x+3, and y = x2+4x+3. a. Identify how these equations are the same. Identify how they are different. b. Predict how the graphs of these functions are different. Give reasons for your answer. c. Graph all four functions in the same viewing window. Was your prediction about the graphs correct? If not, modify your explanation to account for any differences. The general quadratic function is defined by y = ax2+bx+c where a, b, and c are real number constants. What information about the graph can be determined from the value of c? Assume b and c are constant. What happens to the graph as the value of a gets larger? Assume b and c are constant. What happens to the graph if the sign of a is changed? Assume a and c are constant. What happens to the graph as the value of b increases?


