Week 8 Practice Quiz c Answers
advertisement

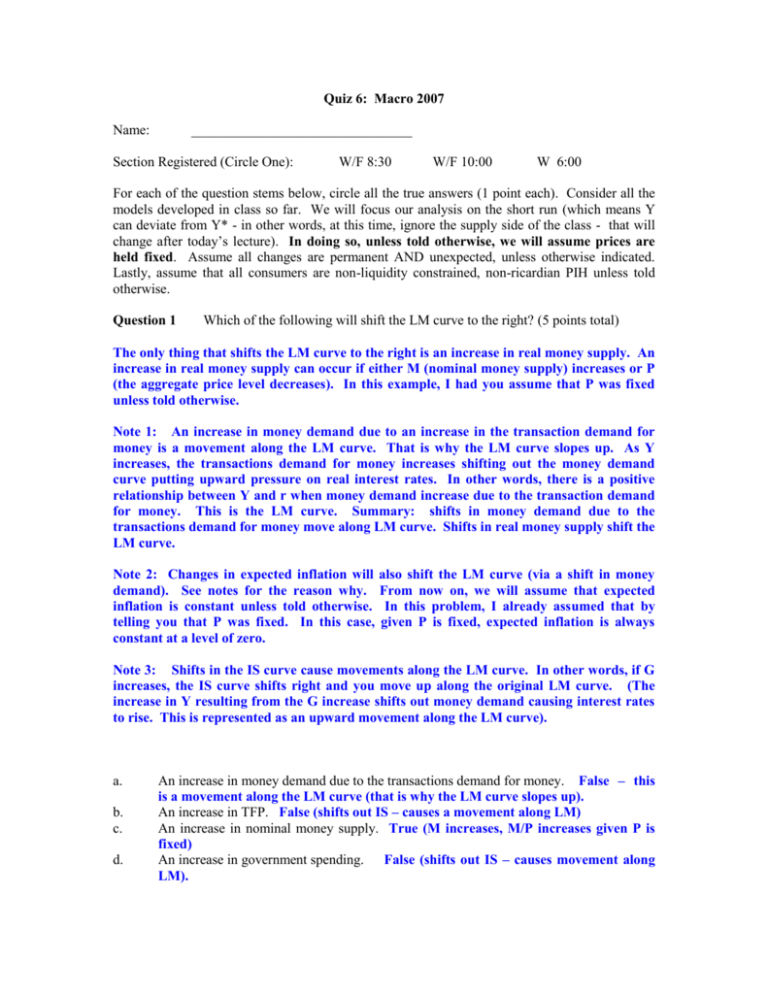
Quiz 6: Macro 2007 Name: ________________________________ Section Registered (Circle One): W/F 8:30 W/F 10:00 W 6:00 For each of the question stems below, circle all the true answers (1 point each). Consider all the models developed in class so far. We will focus our analysis on the short run (which means Y can deviate from Y* - in other words, at this time, ignore the supply side of the class - that will change after today’s lecture). In doing so, unless told otherwise, we will assume prices are held fixed. Assume all changes are permanent AND unexpected, unless otherwise indicated. Lastly, assume that all consumers are non-liquidity constrained, non-ricardian PIH unless told otherwise. Question 1 Which of the following will shift the LM curve to the right? (5 points total) The only thing that shifts the LM curve to the right is an increase in real money supply. An increase in real money supply can occur if either M (nominal money supply) increases or P (the aggregate price level decreases). In this example, I had you assume that P was fixed unless told otherwise. Note 1: An increase in money demand due to an increase in the transaction demand for money is a movement along the LM curve. That is why the LM curve slopes up. As Y increases, the transactions demand for money increases shifting out the money demand curve putting upward pressure on real interest rates. In other words, there is a positive relationship between Y and r when money demand increase due to the transaction demand for money. This is the LM curve. Summary: shifts in money demand due to the transactions demand for money move along LM curve. Shifts in real money supply shift the LM curve. Note 2: Changes in expected inflation will also shift the LM curve (via a shift in money demand). See notes for the reason why. From now on, we will assume that expected inflation is constant unless told otherwise. In this problem, I already assumed that by telling you that P was fixed. In this case, given P is fixed, expected inflation is always constant at a level of zero. Note 3: Shifts in the IS curve cause movements along the LM curve. In other words, if G increases, the IS curve shifts right and you move up along the original LM curve. (The increase in Y resulting from the G increase shifts out money demand causing interest rates to rise. This is represented as an upward movement along the LM curve). a. b. c. d. An increase in money demand due to the transactions demand for money. False – this is a movement along the LM curve (that is why the LM curve slopes up). An increase in TFP. False (shifts out IS – causes a movement along LM) An increase in nominal money supply. True (M increases, M/P increases given P is fixed) An increase in government spending. False (shifts out IS – causes movement along LM). e. A decrease in labor income tax rates. LM). False (shifts out IS – causes movement along Question 2 Consider the IS-LM curve modeled in class. Which of the following are true about the new short run equilibrium? (Hint: your analysis should ONLY be confined to the IS and LM curves). (7 points total) a. An increase in TFP will increase both interest rates and output. True – TFP increase will increase both C and I (holding r constant). The increase in TFP will cause real wages to increase (increasing PVLR) causing C to increase. The increase in TFP will also cause MPK to increase causing I to increase. Both will shift out the IS curve. The LM curve will not change given that M is not changing and I told you to assume that P is fixed. As the IS curve shifts out, both r and Y will increase. Draw the graph and prove it to yourself!. b. An increase in government spending will increase output and decrease interest False – an increase in G will shift out the IS curve causing Y and r to increase (i.e., r will NOT decrease). . c. An increase in the nominal money supply will increase both output and interest rates. False – an increase in M will shift LM to the right causing Y to increase and r to fall. This was a very easy question. When the Fed increases the money supply, they are essentially reducing interest rates! d. An increase in the price level will cause both output and interest rates to decline. False. If M is fixed, an increase in P will cause M/P to fall causing the LM curve to shift in. This will cause r to increase and Y to fall. e. An equal increase in both M and P (in percentage terms) will cause both interest rates to fall and output to increase. False. Equal increases in both M and P (in percentage terms) will leave M/P unchanged. If M/P is unchanged, there is no effect on the LM curve and nothing in the economy changes (all else equal). In other words, Y and r are both constant. f. An increase in labor income tax rates will cause output to decrease and investment to increase. True. An increase in labor income taxes will shift in the IS curve (because C will fall). This will cause Y to fall. As Y falls, money demand shifts in and interest rates fall (move along the LM curve). However, the fall in interest rates will spur investment. So, C will fall and I will increase. The net effect on Y is that Y will fall. We know that Y will fall because the only reason that I is increasing is because Y is falling (causing money demand to shift in and interest rates to fall – if Y didn’t fall, then interest rates wouldn’t have fallen!!!) Question 3 points total) Which of the following will shift the aggregate demand curve to the right? (5 The AD shifts to the right any time the IS curve shifts right OR when the LM shifts right for any reason other than a change in prices. A change in prices is represented as a movement along the AD curve. Specifically, as P increases, M/P falls, interest rates rise, I falls and Y falls. The increase in P causes Y to fall (via a decline in investment). This is why the AD slopes down. If P is held fixed, increasing M will cause M/P to increase causing r to fall and I to increase (causing Y to increase). So, increases in M will be represented as a rightward shift in the AD curve (at any given P, an increase in M leads to higher Y). a. b. c. d. e. An increase in government spending True (increase in G) An increase in the nominal money supply. True (increase in I) An increase in TFP. True (increase in C and I) An increase in the price level. False – causes a movement along AD curve (as I falls) A decrease in labor income taxes. True (increase in C) Question 4 Suppose that within a country, the velocity of money always increases by 2% per year and real GDP always increases by 4% per year. Suppose, also, that within that country, the nominal money supply always increases by 10% per year. Lastly, assume that real interest rates within that country are always 6% per year. According to Friedman’s Quantity Theory of Money, what would be the annual inflation rate in that country? (4 points). <<Hint: Not all information is necessarily relevant>>. Show your work and put your answer in the box. Friedman’s Quantity Theory of Money Says: M * V = P * Y where M is the nominal money supply, V is velocity of money, P is price level and Y is real GDP. This comes from the exact definition of velocity (i.e., V is formally defined as (P*Y)/M.). See notes for details. If we take log differences of the above equation (i.e., take logs of the quantity theory today and subtract it from the log of the quantity theory yesterday), we get: %ΔM + %ΔV = %ΔP + %ΔY For the economy above, I gave you the percentage growth in M, V and Y. Plugging those into this equation yields that the inflation rate (i.e., the percentage growth in P) had to be 8% (10% + 2% - 4%). The real interest rate is not relevant information in this problem! However, I could have asked what nominal interest rates were in this economy and you would have told me 14% (r + expected inflation = i). I will also give credit for the answer of 6% (it is just a coincidence that this number equals the real interest rate – I didn’t intend for that to occur). The 6% is also correct if you assumed that the growth in velocity was zero. I told you that it wasn’t zero, but the original Friedman theory assumed that velocity growth was equal to zero. The way the question was phrased, I said according to Friedman’s Quantity Theory of Money. The literal Friedman theory had velocity growth constant. So, I will also give credit if you assumed that that growth in V was zero (as long as you showed your equation and didn’t just pick 6% randomly). We will also give partial credit if you indicated that you knew what the quantity theory was.


