STAT 452/652 EXAM 2 – DUE Wednesday, November 28 at class time
advertisement
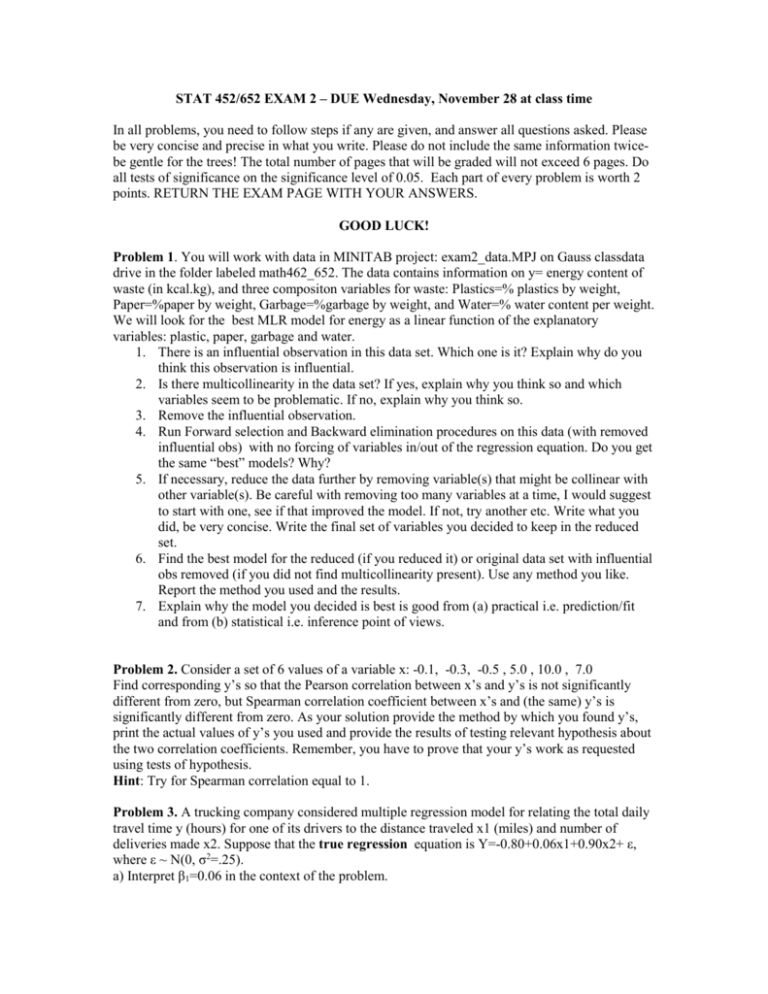
STAT 452/652 EXAM 2 – DUE Wednesday, November 28 at class time In all problems, you need to follow steps if any are given, and answer all questions asked. Please be very concise and precise in what you write. Please do not include the same information twicebe gentle for the trees! The total number of pages that will be graded will not exceed 6 pages. Do all tests of significance on the significance level of 0.05. Each part of every problem is worth 2 points. RETURN THE EXAM PAGE WITH YOUR ANSWERS. GOOD LUCK! Problem 1. You will work with data in MINITAB project: exam2_data.MPJ on Gauss classdata drive in the folder labeled math462_652. The data contains information on y= energy content of waste (in kcal.kg), and three compositon variables for waste: Plastics=% plastics by weight, Paper=%paper by weight, Garbage=%garbage by weight, and Water=% water content per weight. We will look for the best MLR model for energy as a linear function of the explanatory variables: plastic, paper, garbage and water. 1. There is an influential observation in this data set. Which one is it? Explain why do you think this observation is influential. 2. Is there multicollinearity in the data set? If yes, explain why you think so and which variables seem to be problematic. If no, explain why you think so. 3. Remove the influential observation. 4. Run Forward selection and Backward elimination procedures on this data (with removed influential obs) with no forcing of variables in/out of the regression equation. Do you get the same “best” models? Why? 5. If necessary, reduce the data further by removing variable(s) that might be collinear with other variable(s). Be careful with removing too many variables at a time, I would suggest to start with one, see if that improved the model. If not, try another etc. Write what you did, be very concise. Write the final set of variables you decided to keep in the reduced set. 6. Find the best model for the reduced (if you reduced it) or original data set with influential obs removed (if you did not find multicollinearity present). Use any method you like. Report the method you used and the results. 7. Explain why the model you decided is best is good from (a) practical i.e. prediction/fit and from (b) statistical i.e. inference point of views. Problem 2. Consider a set of 6 values of a variable x: -0.1, -0.3, -0.5 , 5.0 , 10.0 , 7.0 Find corresponding y’s so that the Pearson correlation between x’s and y’s is not significantly different from zero, but Spearman correlation coefficient between x’s and (the same) y’s is significantly different from zero. As your solution provide the method by which you found y’s, print the actual values of y’s you used and provide the results of testing relevant hypothesis about the two correlation coefficients. Remember, you have to prove that your y’s work as requested using tests of hypothesis. Hint: Try for Spearman correlation equal to 1. Problem 3. A trucking company considered multiple regression model for relating the total daily travel time y (hours) for one of its drivers to the distance traveled x1 (miles) and number of deliveries made x2. Suppose that the true regression equation is Y=-0.80+0.06x1+0.90x2+ ε, where ε ~ N(0, σ2=.25). a) Interpret β1=0.06 in the context of the problem. b) What is the probability that travel time will be at most 6 hours when 4 deliveries are made and the distance traveled is 50 miles? Problem 5. These questions are True/False. Circle the correct answer. a. True or False. To conduct analysis/inference in Multiple Linear Regression, we must assume that the explanatory variables are normally distributed. b. True or False. A study was conducted to investigate how the suicide rate (Y) varies with age (X) for white males. The fitted linear regression model based on a sample data collected is given by Y=-13.9 + 0.93X. Since the estimate of β1 is b1=0.93>0, we can conclude that for white males there is a positive linear association between suicide rate and age. c. True or False In constructing an (1-α)100% confidence interval for the mean response in x , the simple linear regression given explanatory variables variable x=x*, the closer x* narrower the confidence interval. d. In studying the relationship between the weights and ages of high school girls, a 95% confidence interval for the mean weight (in pounds) of 12 year old girls was computed as (102.3, 106.5). True or False. This interval is interpreted as: The true mean weight of 12-year old girls is between 102.3 and 106.5 pounds with probability 0.95. Problem 4. UNDERGRADUATE STUDENTS ONLY. You will work with data in MINITAB project exam2_data2.MPJ data on Pythagoras classdata drive in the folder labeled math462_652. Find all three (Pearson, Kendall and Spearman) correlation coefficients between y and x and report results of tests about their significance. As usual, you must state the hypotheses you test, report the value of the test stat, the p-value and the conclusion. Work on each correlation coefficient is worth 2 points. Problem 4. GRADUATE STUDENTS ONLY. Generate values for a response y and three explanatory variables (x1, x2, and x3) so that all of the following conditions are satisfied: a) There are 10 observations; b) x1 is not a significant predictor for y; c) x2 and x3 are significant predictors for y; d) 10th observation is an influential one. 1. Describe how you constructed your data set. Explain how did you get each variable. Please be very concise and precise. Do not print the data set. 2. Show that x1 is not a significant predictor for y. That is perform a partial F (or t) test for the appropriate hypothesis. Show results of MINITAB work for this question. 3. Show that x2 and x3 are significant predictors for y. That is perform an appropriate F test. Show results of MINITAB work for this question. 4. Show that 10th observation is influential. That is compute appropriate statistics, show their values and explain why they mean that the observation is indeed influential. If you can not generate a data set with all of the above properties, generate one with 10 obs and at least one of properties b) – d). This will give you partial credit and a data set to work on for some of the questions 1-4.
